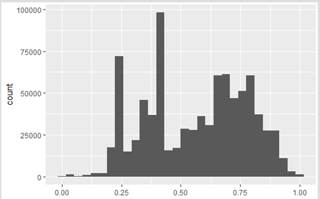
Doing my thesis I came up on a problem where I can't find the answer on. I have a dataset with only categorical predictors with sometimes many levels and a numeric outcome variable bounded between zero and 1. The outcome variable is a given discount percent variable. It is not normally distributed with more then two modes:
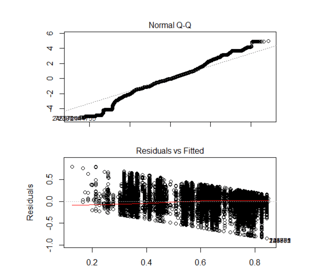
In this case I used 5 predictor variables and Nrows around 850.000 I tried several different algorithms ( betareg, lm, anova, random forest, svr ) But every time this residuals vs fitted plot comes up:
Also when I use a smaller training you will see this downwards trend.
My question is how to interpet this plot and is there a way to deal with this since all my predictor variables are categoric?
I try to find out witch variables of a 200 variables wide dataset have a impact on the given discounts.
Thanks,


