3
$\begingroup$

I am looking at waiting times between two events from multiple patients, so I'm looking at a gamma distribution. Turns out, the model is plotting out an exponential distribution, which if I was to look at something like the arrival times of ambulances at A&E this would make sense. However, I'm now unsure whether I am modelling my data correctly, as I am only looking at a single time-to-event per person, each person being mutually exclusive from the next, and exponential distributions are meant to be memoryless. Surely, any data is memoryless if there is only one event per independent and mutually exclusive case?

The scenario: I would like to plot the probability distribution of the time from a headache diagnosis (H) made in a Doctors (GP in the UK) to a headache diagnosis made at a special referral clinic (R). This is on a per patient basis e.g.,

P1:H------>R

P1:H-------------------->R

P1:H----------->R

P1:H-->R

Is it correct to try modelling this kind of data using a gamma distribution and then would it be logical to end up with an exponential distribution?

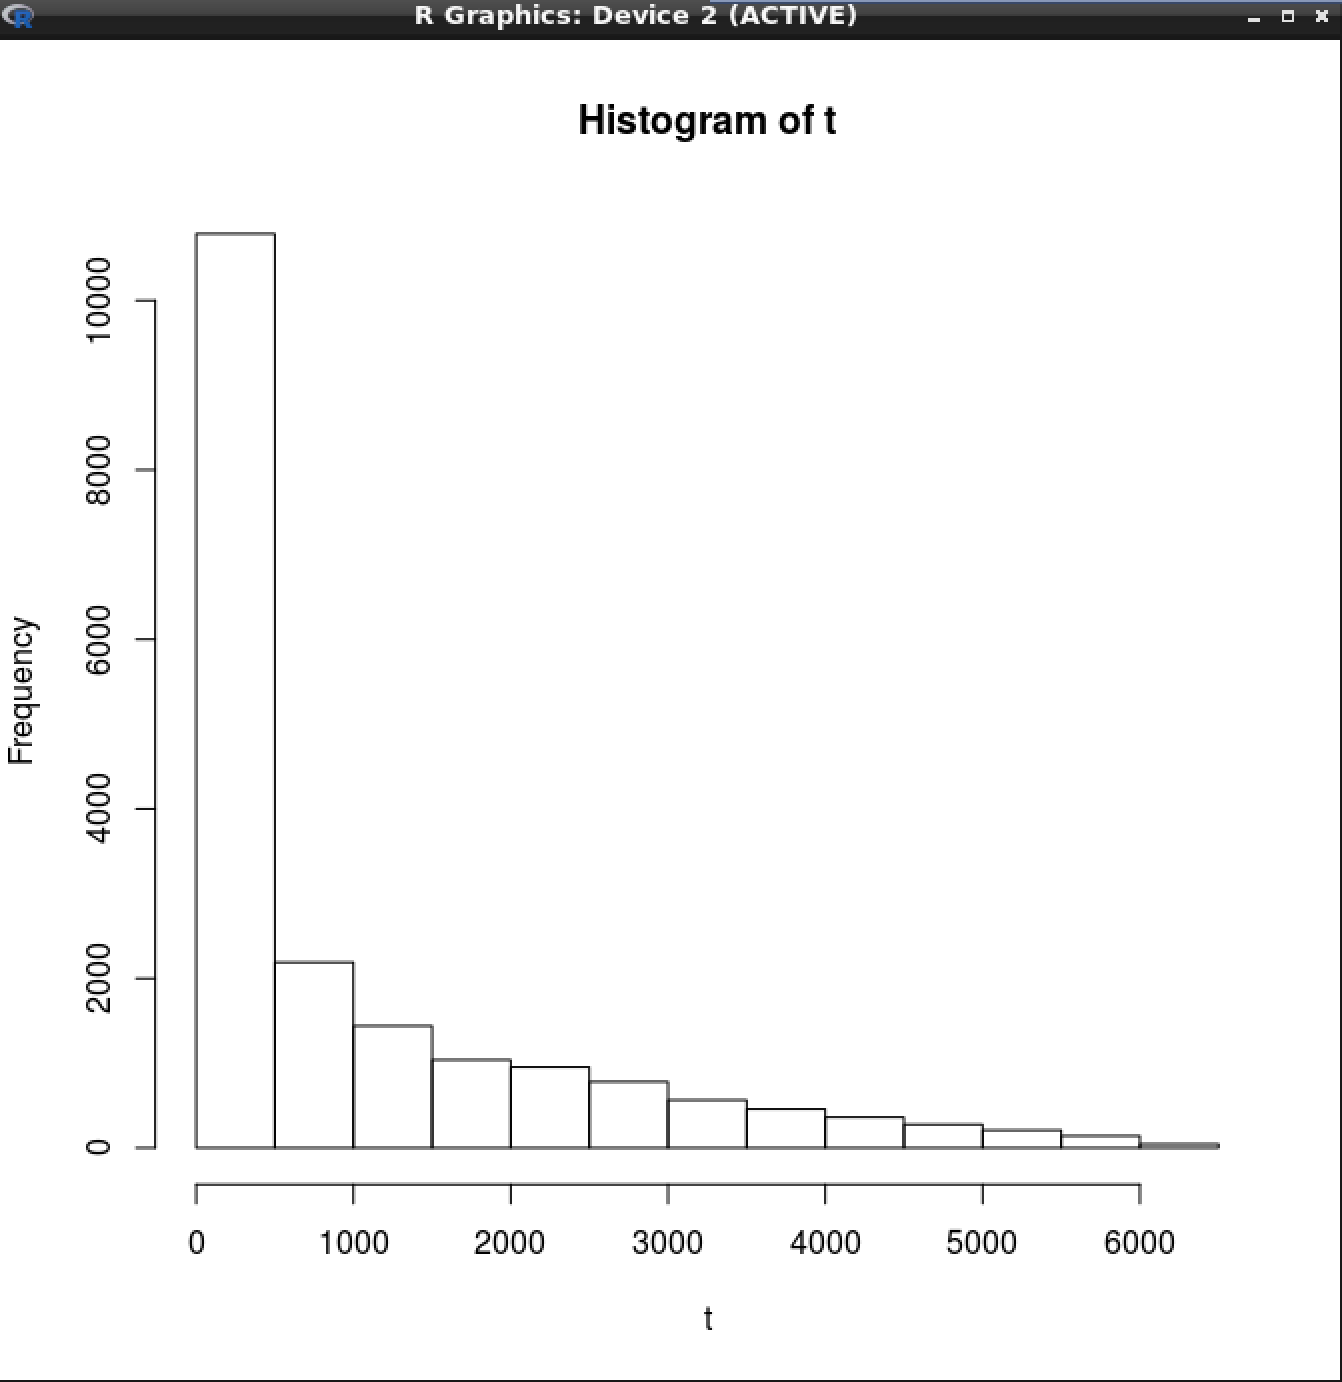
EDIT A histogram distribution of what the data looks like: enter image description here
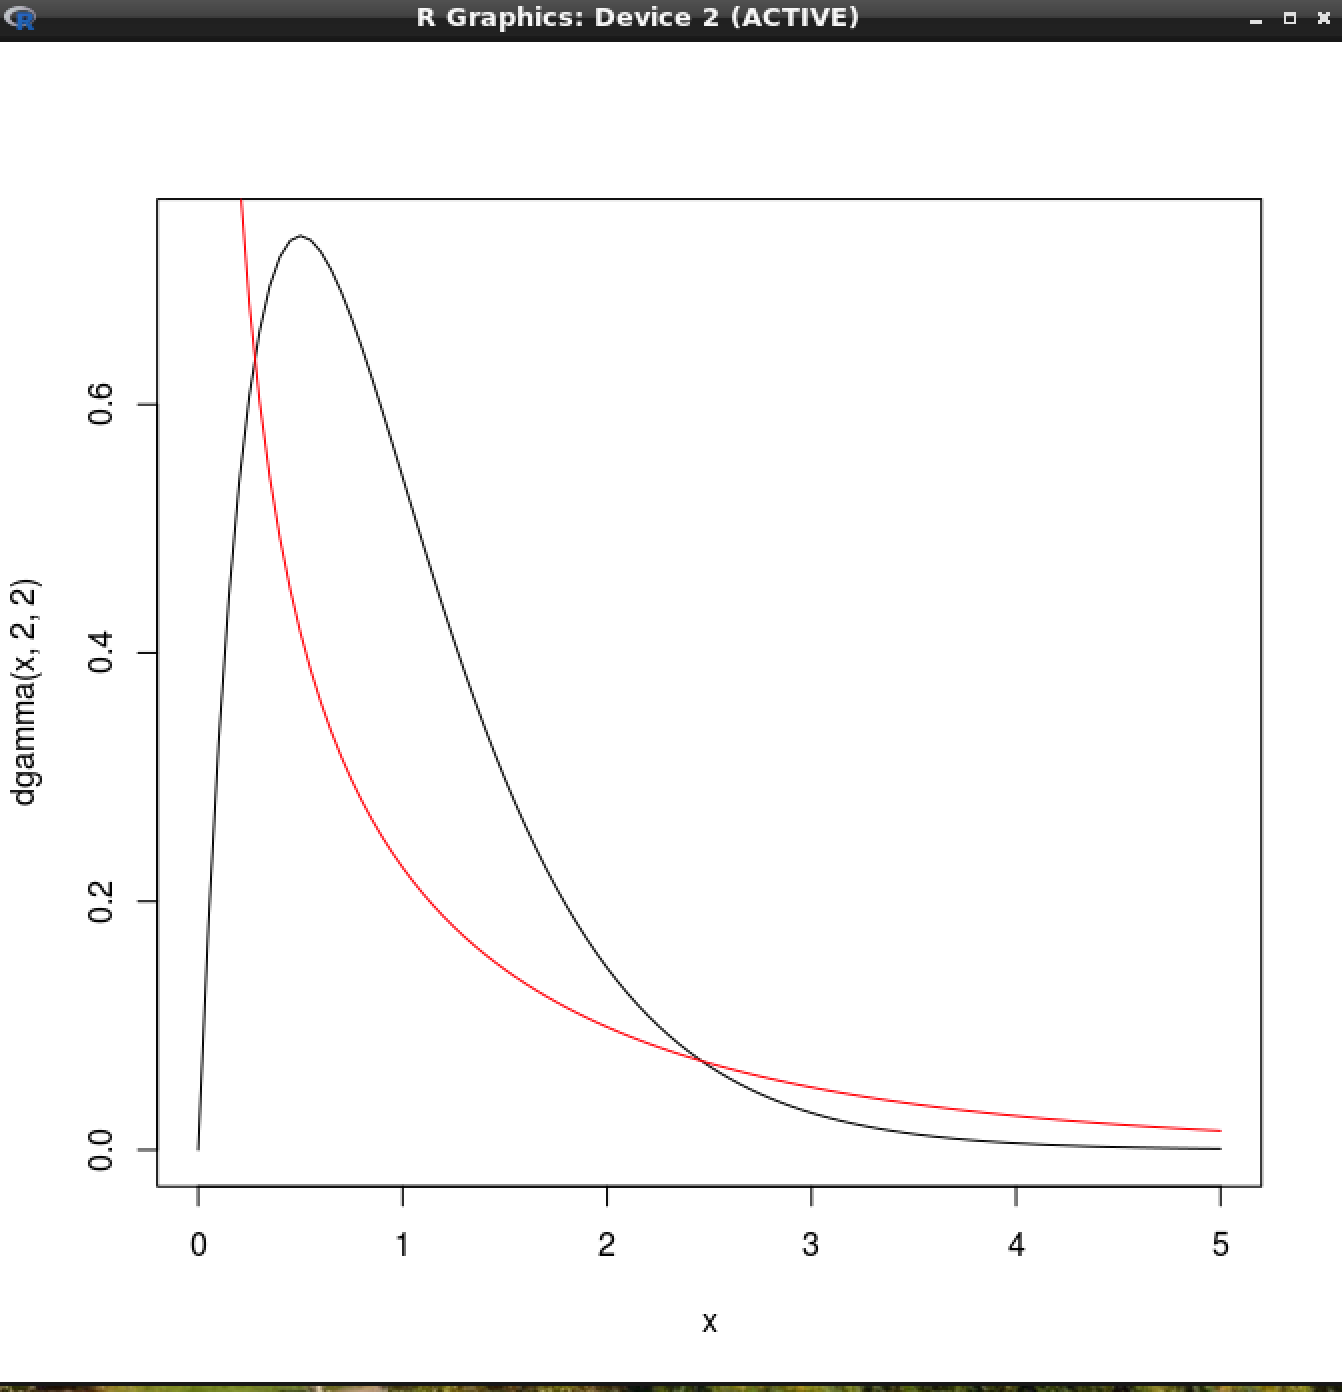
The gamma distribution - Black - idealised gamma distribution. Red - modelling distribution: Black - idealised gamma distribution. Red - modelling distribution.
$\endgroup$
5
  • 2
    $\begingroup$ The Exponential distribution is a special case of the Gamma distribution. See [this summary here][1] for details. You ask if the Gamma is appropriate. What is the CV for the data you're modeling? Have you visually looked at the histogram? Perhaps if you posted some more details we could make better modeling suggestions. [1]: tutor-web.net/math/math612.0/lecture520/slide30 $\endgroup$ Commented Sep 4, 2018 at 20:20
  • $\begingroup$ Added a histogram of the data and what the gamma distribution looks like (like an exponential distribution). What do you mean by CV? $\endgroup$ Commented Sep 4, 2018 at 20:25
  • $\begingroup$ (1) The Coefficient of Variation (CV) is the Standard deviation divided by the mean. It can be a useful quick statistic. $$CV(X) =\frac{\rm{std}(X)}{\rm{mean}(X)}$$ (2) Your histogram has ~13 bins. What was the sample size of your data? (3) Visually, your data looks like it might be modeled by a hyperexponential distribution fairly well depending on the application. $\endgroup$ Commented Sep 5, 2018 at 15:17
  • $\begingroup$ Thank you for that information. The histogram was a quick by-eye calculation in R. My sample size is approx 540,000 patient medical record. $\endgroup$ Commented Sep 5, 2018 at 16:09
  • $\begingroup$ A few more questions: (1) If you want to plot the probability, why not just do it empirically? (2) If you must fit a distribution, have you tried fitting a Gamma to your data and comparing? $\endgroup$ Commented Sep 5, 2018 at 16:21

1 Answer 1

3
$\begingroup$

How to proceed depends largely on your goals. If you need to generate random times from this distribution or have other purposes, I might adjust my answer. What follows is a response to your stated goal:

I would like to plot the probability distribution

Option 1: Do it empirically
You can plot the percentiles (cumulative distribution, aka CDF) just using your data since you have a large sample size ( > 500,000). Estimate the CDF from the data and plot.

Option 2: Fit a distribution and then use that to plot
This requires a validation to make sure the fit works well. Visual inspection is fine since that amount of data will likely make statistical tests find discrepancies with the proposed distribution.

Step 1: Fit some candidate distributions. Since you are interested in the Gamma distribution, fit that and obtain parameter estimates. Then plot the density and compare with your data. If that looks bad (it doesn't look good from your posted graph), fit a Hyperexponential (see how here).

Step 2: Use your fitted distribution to plot.

Hope this helps.

$\endgroup$

Your Answer

By clicking “Post Your Answer”, you agree to our terms of service and acknowledge you have read our privacy policy.

Not the answer you're looking for? Browse other questions tagged or ask your own question.