1
$\begingroup$

I am trying to model a type of event that happens (once) at an unknown time.

I would like to know: given a certain average event time, what is the probability that the event will happen within a certain time period?

I think this would be similar to a Poisson Distribution, but unlike in the Poisson Distribution, it can only happen once. I am not looking for the number of events but for the time until an event (that only occurs once) occurs.

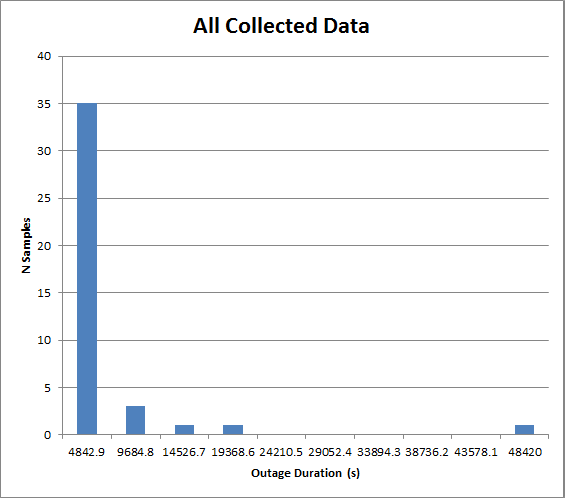
This is being used to model restoration times in an electrical network, and the model will feed into a Monte Carlo simulation. The data is very heavily skewed. A histogram is shown here:

Collected Data

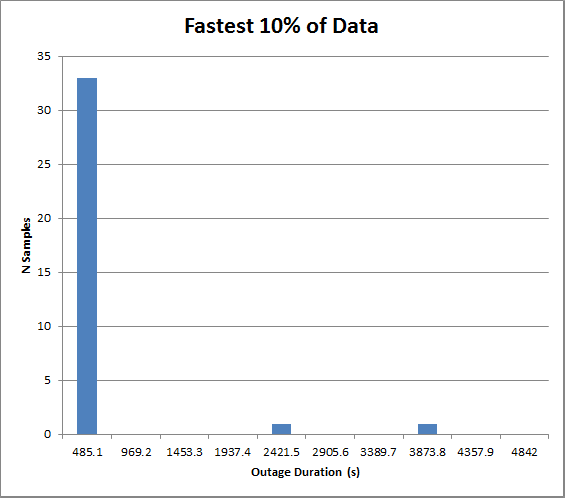
And here is a plot showing data that is shorter than 10% of the longest data point...

Collected Data-Fastest 10%

Raw data (in seconds):

[5, 1980, 5, 2, 5, 2, 5, 240, 66, 120, 9660, 3420, 10740, 48420, 87, 2, 2, 1, 1, 1, 1, 1, 1, 1, 1, 2, 1, 1, 1, 9065, 40, 1, 1, 1, 2, 1, 4, 15029, 7332, 2]

$\endgroup$
13
  • 1
    $\begingroup$ Is there data to support the modeling? $\endgroup$ Commented Sep 5, 2018 at 16:40
  • 1
    $\begingroup$ You need a model for waiting time. In the case of your oven (without being pedantic and suggesting there could be more circumstantial data to get to a more precise result) it is the continuous distribution. (see stats.stackexchange.com/questions/354552/…) $\endgroup$ Commented Sep 5, 2018 at 19:11
  • 2
    $\begingroup$ the point I'm making here is that perhaps the title of your question could be clarified, as it alludes to a different kind of statistical problems, thing like "what's the probability distribution of humankind extinction?", which is a truly one off event, unlike microwave reliability study $\endgroup$
    – Aksakal
    Commented Sep 5, 2018 at 19:40
  • 1
    $\begingroup$ My default choice would be exponential distribution in your case. However, I'd start with historgrams of restoration time. If you show them here, folks might give you more hints $\endgroup$
    – Aksakal
    Commented Sep 5, 2018 at 20:34
  • 1
    $\begingroup$ To echo @Aksakal, I think it would be helpful to edit the question to add (1) histogram of data, (2) sample size of data, (3) and coefficient of variation $CV(X) = \frac{\rm{std}(X)}{\rm{mean}(X)}$. This would enable better suggestions from the community, especially now that we know this supports a Monte Carlo simulation. Just my thoughts. $\endgroup$ Commented Sep 5, 2018 at 21:22

1 Answer 1

1
$\begingroup$

One way to examine your data might be by means of plots of the cumulative distribution (rather than histograms which will be very coarse).

plots

  • One problem is that the data does not follow a simple model. The plots are four different ways to represent the data and a straight line in those plots would correspond to linear relationship (top left), logarithmic relationship (top right), exponential relationship (bottom left), power law relationship (bottom right). None of these graphs show a clear straight line and the danger with this plots is that after taking logarithms there is often more or less a somewhat straight line but it can be meaningless.

    It is likely that the data will have different regions with different behavior but it is very difficult to observe this from gazing at the data (it is too easy to find an accidental pattern that is meaningless in general), What you mostly need will be some more information/knowledge/hypotheses about how your data is expected to behave that can help/guide to form a useful and correct model (e.g. you have events that take 1 second and events that take over 10 hours, why is that? Are htey supposed to be modeled the same? Start by explaining this before your try fitting data).

  • Another problem is that your data might be left censored. You have a lot of measurements at 1 and 2 seconds. The image in the top right shows a line $(1-F(t) = a + b \log(t)$ ) that has been fitted when we exclude those 1 and 2 seconds data. It would extrapolate to observations below 1 and 2 seconds, but possibly you are unable to make those.

$\endgroup$
15
  • $\begingroup$ Your observations are very helpful, thank you. Yes, there is a limitation that I cannot measure data below 1-2 s, and outages faster than this actually cannot really occur anyway (due to "reclosing time"). Perhaps it would make sense to fit and then model an exponential curve with a floor at 1 s, similar to your diagram on the upper right. The other approach that seems reasonable is just to randomly pick times from the actual data. $\endgroup$
    – PProteus
    Commented Sep 7, 2018 at 12:18
  • 1
    $\begingroup$ What are important distinctions. Is it important to know how often you get 1, 2 or 5 seconds or can you just put these all together? What are the relevant distinctions that you wish to make? $\endgroup$ Commented Sep 7, 2018 at 12:32
  • 1
    $\begingroup$ I am looking at weather data over a year, and trying to determine how this will affect temperature of a power line. The outages that we are discussing also affect temperature, because they result in greater power flow through the remaining lines, which heats up the conductor. In all, however, the impact of these outages impacts the final result by less than 1%. $\endgroup$
    – PProteus
    Commented Sep 7, 2018 at 13:50
  • 1
    $\begingroup$ The result that I am trying to determine is essentially just how much time does a line spend above a certain temperature. Perhaps even just using an average outage time every time would work fine, but I am also considering adding thermal mass/thermal time constant to the model, and this non-linear behaviour would skew the results, ever so slightly, particularly as short duration outages would then all be assumed to be of average duration. $\endgroup$
    – PProteus
    Commented Sep 7, 2018 at 13:58
  • 1
    $\begingroup$ This suddenly sounds like a much more interesting question. I will follow up on this during the weekend because it does change the angle at which the problem should be viewed. $\endgroup$ Commented Sep 7, 2018 at 14:25

Your Answer

By clicking “Post Your Answer”, you agree to our terms of service and acknowledge you have read our privacy policy.

Not the answer you're looking for? Browse other questions tagged or ask your own question.