1
$\begingroup$

I have a dataset of 165 positive and 1700 negative. For training I balanced them to 132 positive (80%) and 132 negative (80% of minority class). For testing, I leave the default natural distribution ratios (i.e. 33 (20%) positive and 340 (20%) negative).

I am performing 10-fold inner cross-validation using the libsvm default implementation (i.e. I have no access to that data, except the accuracy output at the end). I only use inner-cross-validation for model selection, i.e. to obtain the best hyper-parameters from a grid search on cost and gamma for the RBF kernel.

For outer cross-validation, I want to also perform 10-fold. For these outer-cv predictions (with probability sores) on 'test sets' (i.e. 10 different test sets, since it is 10-fold cv), what is the best practice method to combine these results to generate a ROC or PR curve?

For having a single value I know that the mean average could be taken. However, I want to actually generate the data for plotting the ROC or PR graphs. I already know how to build ROC or PR graphs from a single prediction list, but how about multiple lists from outer-cross-validation? Should I merge the lists into one long list, should I take the mean average for each fold, or the mean average of each point of each fold?

Please note, I am not asking about specific implementations but how to actually implement it from scratch.

Thank you.

$\endgroup$

1 Answer 1

4
$\begingroup$

I'm not sure I understand what you propose doing with averaged data (by fold or by "point"). Each single prediction generates a point on the ROC/PR curve, so averaging cases in any way would throw away that information.

However, you can calculate ROC/PR curves either by

  • calculating one curve per fold (or per iteration) which emphasizes that you did in fact test 10 different surrogate models, or by
  • merging the 10 lists into one long list (which corresponds to the underlying assumption of the cross validation that the k surrogate models are equvalent to each other and to the model built on the whole data set: they are used in place of the whole-data-model and that's the case for predictions of all folds). However, this is only sensible if the scores have the same meaning across the folds. This is the case e.g. for libsvm predicted probabilities.

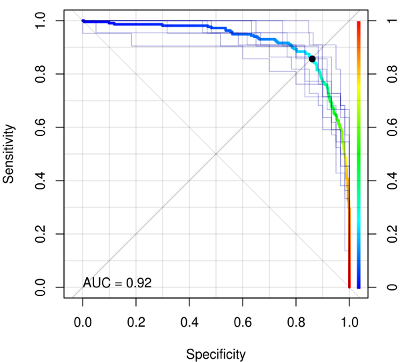
I often do plot both: The per fold (or per iteration/repetition) curves give a visual impression on the uncertainty of the test results, whereas the combined curve is the best estimate we have.

What does make sense (and where "averaging" comes in) is to also plot the single working points given by a pre-determined cutoff for the scores. That can either be an externally pre-defined cutoff or a cutoff optimized in the inner CV (though with your setup that would probably not work as the optimization cannot account for the class imbalance due to your sampling!)

Here's an example:

ROC with various entries

  • thin lines give 10 different runs (in your case that would be folds)
  • thick line gives ROC of long list (scores here were posterior probabilities so can be combined meaningfully)
  • black dot gives sens/spec for prediction of class labels (pooled over all models, as usual for cross validation) by each surrogate model with its own working point which was automatically determined in inner optimization during training to yield sensitivity = specificity.
$\endgroup$
2
  • 1
    $\begingroup$ you are a great teacher, thank you so much. I always learn so much from your answers. If you had a book, I would buy it. $\endgroup$
    – Aalawlx
    Commented Sep 16, 2018 at 11:54
  • $\begingroup$ For the ROC created by the long list, can you calculate valid confidence intervals by delong's method? $\endgroup$ Commented Nov 5, 2021 at 11:11

Your Answer

By clicking “Post Your Answer”, you agree to our terms of service and acknowledge you have read our privacy policy.

Not the answer you're looking for? Browse other questions tagged or ask your own question.