0
$\begingroup$

I am learning to use Python for my statistical analyses, and while figuring out how to perform a 2-way ANOVA with statsmodels I found that my Python code yielded slightly aberrant values. Comparing the outputs you can see that the SS_Factor_1 values, and the Adjusted R2 are different for Python vs SPSS/Graphpad. Is this because of a mistake in my code, or some other reason? Are these differences due to something inherent in each software and so small I should just ignore them?

Python code:

formula = 'dependent_variable ~ C(factor_1) * C(factor_2)'
model = ols(formula, data=df_freq_time).fit()
aov_table = anova_lm(model, typ=2)
aov_table

Python output: output
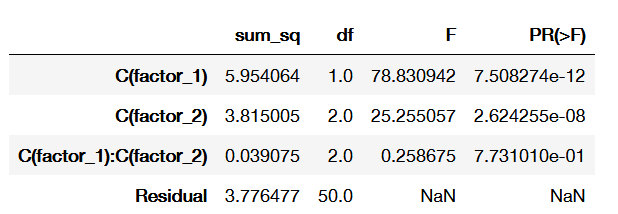
Also R2 = 0.722, and adj R2 = 0.694

SPSS 2-way ANOVA results: SPSS output ANOVA table
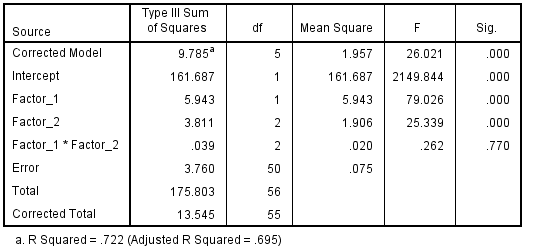
Graphpad Prism 2-way ANOVA results: Graphpad output ANOVA table

$\endgroup$
2
  • $\begingroup$ Do you get the same numbers in python if you use type 3 ANOVA, typ=3? (The differences are small, but look too small for differences in definition and too large for purely numerical precision issues.) $\endgroup$
    – Josef
    Commented Sep 20, 2018 at 1:01
  • $\begingroup$ I thought it was too big a difference to be a precision issue as well. Using typ=3 gives me this output. It introduces an intercept and changes the sum of squares for all of the terms. I tried typ=1, and that just made the same output table as typ=2 but added a column for mean square values. $\endgroup$
    – user219200
    Commented Sep 20, 2018 at 4:53

1 Answer 1

2
$\begingroup$

You can see that SPSS and GraphPad are the same, but your code's results are off. It's probably due to use of Type III sum-of-squares. Other things known to affect differences in SS are unbalanced sample size and missing data.

You're actually doing this the wrong way. You should be using a textbook which goes through a worked problem for a 2-way ANOVA with an interaction term and Type III SS, with intermediate calculations so you can find out where your code is making an error.

$\endgroup$
1
  • 1
    $\begingroup$ I might be misunderstanding your answer, but to clarify the anova_lm() function is a built-in function of the statsmodels package. I did not code it. For some reason specifying type III sum of squares (by setting typ=3) results in even stranger output, whereas the type II and III SS settings yield close to correct results. $\endgroup$
    – user219200
    Commented Sep 24, 2018 at 16:21

Your Answer

By clicking “Post Your Answer”, you agree to our terms of service and acknowledge you have read our privacy policy.

Not the answer you're looking for? Browse other questions tagged or ask your own question.