Based on your question title, I'll interpret "add zeros in a way that it is correlated with one or more elements of X (independent variables)" as "simulate from a fitted zero inflated model, with the amount of zero inflation dependent on the regressors". Here is a useful overview for modeling zero-inflated data in R.
We load the pscl package for the tools required and fit a ZIP model for the built-in dataset bioChemists.
require(pscl)
fm_zip2 <- zeroinfl(art ~ . | ., data = bioChemists)
Note that we specify that the amount of zero inflation must depend on the predictors - specifying art ~ . | 1 would amount to a zero inflation independent of the regressors.
Now we want to simulate counts from this model. We specify the maximum number of counts we would like to simulate:
max_count <- 30
For the simulation, we need to specify the covariate values. We will simply use the first data row in bioChemists as the newdata. We use the predict command (see ?predict.zeroinfl) with type="prob".
probs_predicted <- predict(fm_zip2,newdata=bioChemists[1,],type="prob",at=0:max_count)
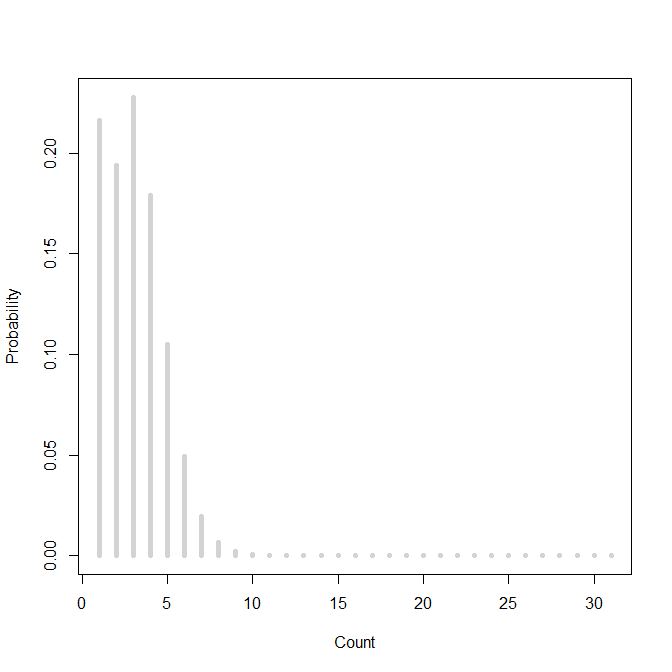
Plotting the fitted probabilities for each count shows some zero-inflation:
plot(probs_predicted[1,], type="h", lwd=5, col="lightgray", xlab="Count", ylab="Probability")

We can now sample from the specified counts with the fitted probabilities:
set.seed(1)
xx <- sample(x=0:max_count,size=1e6,prob=probs_predicted[1,],replace=TRUE)
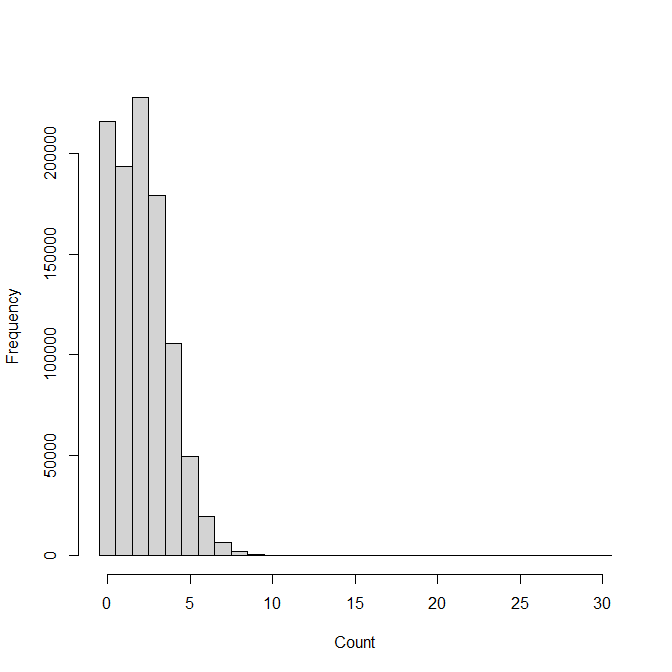
hist(xx,xlab="Count",breaks=seq(-0.5,max_count+0.5),col="lightgray",main="")

The two graphs align nicely, so we seem to be doing the right thing.
You can specify appropriate values for your predictors and sample more or fewer values as you see fit.


