4
$\begingroup$

Question

A binary logistic regression model has been fitted, with the following output;

    Coefficients

    Term                Coef  SE Coef         95% CI          Z-Value  P-Value 
    Constant           -9.80     3.02    (  -17.00,   -4.19)    -3.12    0.001
    A                   0.756    0.510   (  -0.150,   1.552)     1.58    0.103 
    B                   0.0406   0.0201  ( -0.0046,  0.0798)     1.79    0.069
    A*B                -0.00303  0.00298 (-0.00897, 0.00341)    -0.91    0.341 

    Odds Ratios for Continuous Predictors

            Odds    95%
            Ratio    CI
    A          *   (*, *)
    B          *   (*, *)

Where $A,B$ are both continuous values $> 0$.

How would one give and interpret the odds ratios for one of $A$ or $B$ here?

Typically one would state that (for $A$ here) the odds ratio would be $\exp(0.756 ) = 2.13$, but given there's interaction this is less clear.

As the variables are continuous it also seems more confusing, if $B$ was been a binary value then could interpret the model as

$$ \text{log} \left( \frac{p}{1 - p} \right) = \beta_0 + \beta_1 A + \beta_2 B + \beta_3 A \times B $$

If $B = 0$ then

$$ \text{log} \left( \frac{p}{1 - p} \right) = \beta_0 + \beta_1 A $$

If $B = 1$ then

$$ \text{log} \left( \frac{p}{1 - p} \right) = \beta_0 + ( \beta_1 + \beta_3 )A $$

And state that if $B$ is present then an increase of $A$ by one unit increases the odds by a factor of $\exp(\beta_1 + \beta_3) = \exp(0.756 - 0.00303)$. And if $B$ is not present then an increase of $A$ by one unit increases the odds by a factor of $\exp(\beta_1)$

How to go about computation and interpretation of odds ratios in the case of interaction with continuous variables?


Why I don't think this is a duplicate

From exp (coefficients) to Odds Ratio and their interpretation in Logistic Regression with factors , talks about using categorical variables and has only one factor with three levels (red, orange, blue)

Interaction Test with Odds Ratio didn't talk about a similar scenario to my question.

Log odds ratio and unadjusted log odds ratio when we have a continuous variable sounds similar, but is really about putting the continuous variables into buckets rather than the interpretation of them in the context that I have given.

Comparing odds ratios of continuous and discrete variables is discussing their design.

Interpretation of continuous by continuous interaction in binary regression model doesn't have an answer, in the comments there are links to this post and this post, neither of which appear to answer the question, or mine.

Odds ratios for continuous independent variables [duplicate] has been flagged as a duplicate, although the post that has been linked ( this post ) doesn't appear to answer the problem as it's talking about categorical variables ( I have mentioned this post already, red, orange, blue).

In the last thread linked above whuber has stated the information is already there, I feel that it would be a good idea to have an explicit answer in relation to the example that I have provided as the topic seems to be confusing to other learners as well as myself.

$\endgroup$

3 Answers 3

4
$\begingroup$

As others have noted, it is probably easier to interpret this graphically. I will make certain assumptions to demonstrate the thought process for interpreting interactions like this:

  • $A$ is my predictor of interest, so I will interpret the odds ratio of $A$ at varying levels of $B$, and
  • $B$ has a range $[0, 100]$ with mean of 50 and most values falling in $[25, 75]$ such that this is the range of interest.

In the scenario I have set up, the actual log odds of $A$, 0.756, is probably not of interest since it is the log odds of $A$ when $B=0$ and $B=0$ applies to so few people in the data that we do not care for it.

I will calculate the log-odds of $A$ when $B=\{25,50,75\}$. This results in:

\begin{align} \beta_1 + \beta_3 \times \{25, 50, 75\}&{}=\\ 0.756 -0.00303 \times \{25, 50, 75\}&{}=\\ \{0.756 -0.07575, 0.756 -0.15150, 0.756 -0.22725\}&{}=\\ \{0.68025, 0.60450, 0.52875\} \end{align}

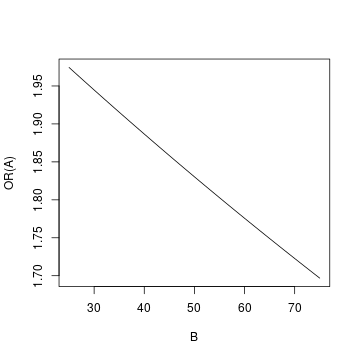
The odds ratio of $A$ will then be $1.97\ (e^{0.68025})$, $1.83\ (e^{0.60450})$, $1.70\ (e^{0.52875})$ when $B=\{25, 50, 75\}$ respectively.

So you find that the odds ratio of $A$ drops as the value of $B$ increases. We can also graph the set-up at varying values of B:

enter image description here

To create the graph, I used all integer values of $B$ in $[25, 75]$.

$\endgroup$
3
  • $\begingroup$ From this then, it's not possible to only give the odds ratio of $A$ in this context? By which I mean, reporting $\exp(0.756)$ is incorrect because of the interaction ( I can't report this as being adjusted for B and AxB ). And in the case of $\exp(\beta_1 + \beta_3 \times B )$ it's not an odds ratio only for $A$, because it contains B. Does that make sense? Thanks $\endgroup$
    – baxx
    Commented Nov 18, 2018 at 1:38
  • $\begingroup$ @baxx something like that. It depends on the value of B. You effectively tie them together by setting up an interaction. $\endgroup$ Commented Nov 18, 2018 at 1:47
  • $\begingroup$ @baxx there's nothing stopping you from interpreting the exponentiated coefficient but it's only true when B = 0. And as in my example, that can be grossly irrelevant. $\endgroup$ Commented Nov 18, 2018 at 2:04
4
$\begingroup$

If your predictors A and B are both continuous and they interact in their effect, then your binary logistic regression model is:

$$ \text{log(p/(1-p))} = \beta_0 + \beta_1 A + \beta_2 B + \beta_3 A \times B $$

where p is the conditional probability of "success" given A and B. (In other words, p is the conditional probability that your binary outcome variable takes the value 1 rather than 0 given A and B, where 1 = "success" and 0 = "failure".) Furthermore, p/(1-p) denotes the conditional odds of "success" given A and B.

Assume you are now interested in the effect of A on the (conditional) log odds of "success"; because A and B interact, the effect of A depends on the (effect of) B and you can determine it by re-expressing the above model like this:

$$ \text{log(p/(1-p))} = \beta_0 + (\beta_1 + \beta_3 B) A + \beta_2 B $$

Thus, via exponentiation of the coefficient of A in the above model re-expression, you can determine that a 1-unit increase in the value of A changes the odds of "success" by a multiplicative factor of $exp(\beta_1 + \beta_3 B)$.

You can give B certain values to see more explicitly how this multiplicative factor describing the effect of A on the odds of success gets affected by the values of B - for example, consider values for B such as mean(B) - sd(B), mean(B), mean(B) + sd(B) if the distribution of B is roughly symmetric and unimodal.

A similar argument as described above can be used to quantify the effect of B on the odds of success as a function of (the effect of) A.

$\endgroup$
5
  • $\begingroup$ logit is function, such as log. so logit itself has no meaning. $\endgroup$
    – user158565
    Commented Nov 17, 2018 at 20:08
  • 2
    $\begingroup$ @a_statistician in certain fields, it is common to use logits as shorthand for log odds. So it is not so strange to see something like "expected logits" $\endgroup$ Commented Nov 17, 2018 at 22:14
  • 2
    $\begingroup$ @a_statistician: It is clear from the question that baxx uses logit as a shortcut for the log odds of success. But I modified my answer to appease your concern. You should have added your comment underneath the question itself - as a statistician, I know what logit stands for but I wanted to use a language that baxx can easily understand. If you find my answer unsatisfactory, nobody is stopping you from adding your own answer. Personally, I don't like taking away from other people's answers - I'd rather provide a different answer. Otherwise, I may come across as the "Answer Police". $\endgroup$ Commented Nov 17, 2018 at 22:51
  • 1
    $\begingroup$ Maybe this is an instance of mansplaining? It makes me sad if that is the case. Presumably, we are all here to help other people. $\endgroup$ Commented Nov 17, 2018 at 22:58
  • 1
    $\begingroup$ I understood what you meant @IsabellaGhement and what you're saying is consistent with what I understood it to mean. I can't comment about standards or such though, I'll edit my post to reflect this notation $\endgroup$
    – baxx
    Commented Nov 17, 2018 at 23:07
3
$\begingroup$

It is not easy to put this into words or to visualise it but let us attempt the task.

The coefficient is, as the output suggests, for the value of $A*B$ so let us suppose that has the value 4. We know that $e^{4 * -0.00303} = 0.988$. This means that for an increase in $A*B$ of 4 the predicted odds are multiplied by 0.988. Now it does not matter how you got to increase $A*B$ by 4, it could be by increasing $A$ by 1 and $B$ by 4, $A$ by 4 and $B$ by 1, or increasing each by 2, or any of the uncountably many ways of making their product 4. You have to include the coefficients for $A$ and $B$ as well to get the full picture, of course.

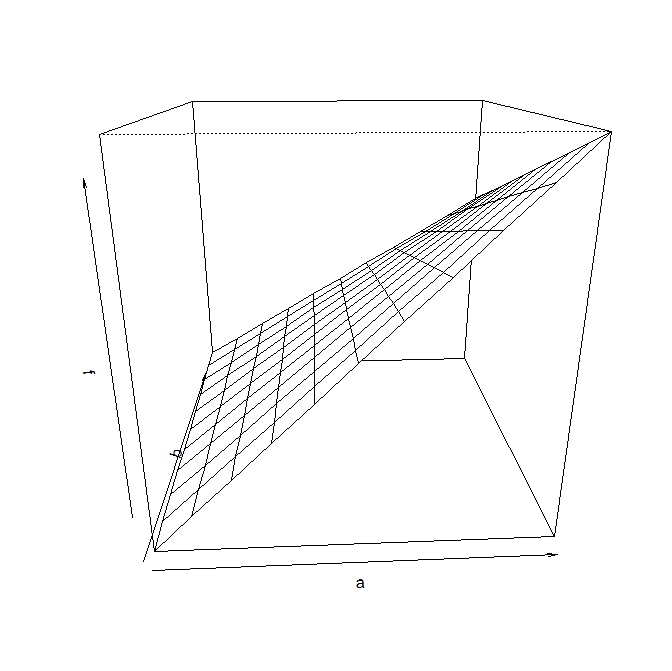
Perspective plot of the logit as a function of a and b

The perspective plot shows the value of the equation specified in terms of the logit for values of $A$ and $B$ from 0 to 100 (denoted f, a and b in the plot). Note the very slight inclination in both directions corresponding to the small interaction effect. Despite the apparent curvature this is just an optical effect the surface is flat.

I would speculate that the reason we see so few linear by linear interactions in my field is because they are so hard to understand and explain to the readers.

$\endgroup$
4
  • $\begingroup$ so given this how would one go about considering the odds ratio for $A$? Presumably to state that the odds ratio for $A$ is $\exp(0.756)$ would be incorrect, as we have the interaction present as well. However, I can't consider cases because $B$ doesn't have levels, it's a continuous variable. So I'm still unsure how to go about finding the odds ratio for $A$ in this case. Thanks $\endgroup$
    – baxx
    Commented Nov 17, 2018 at 16:49
  • $\begingroup$ You cannot interpret the main effects in any simple way in the presence of an interaction. In a sense that is what interaction means although it is not usually expressed like that. $\endgroup$
    – mdewey
    Commented Nov 17, 2018 at 16:58
  • $\begingroup$ I'm curious what your thoughts are about the other responses then. Would you consider it valid to interpret the odds ratio for $A$ by choosing a few particular values of $B$ and finding the exponential $\exp(0.756 -0.00303 \times B )$ ? $\endgroup$
    – baxx
    Commented Nov 18, 2018 at 1:38
  • $\begingroup$ Yes, of course it is valid. Anything which helps interpretation is valid. $\endgroup$
    – mdewey
    Commented Nov 18, 2018 at 11:56

Your Answer

By clicking “Post Your Answer”, you agree to our terms of service and acknowledge you have read our privacy policy.

Not the answer you're looking for? Browse other questions tagged or ask your own question.