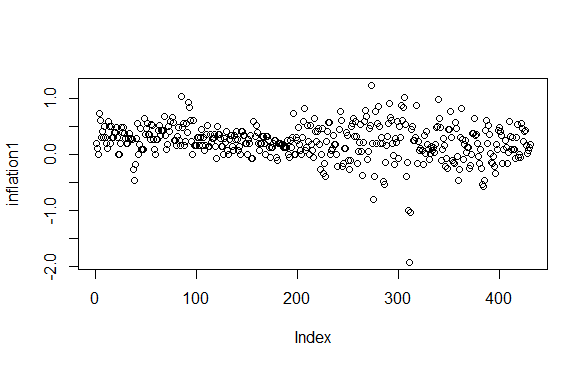
I have a data set that looks like it may not be stationary. As a test, I ran a linear regression of the data against an x variable that was an index of time, 1:400 periods. I saw that the slope coefficient was significant, so I decided the mean was not constant over time. Is this a legitimate procedure for time series data?

$\begingroup$
$\endgroup$
3
-
$\begingroup$ Can you post a plot of your data against the time index x? It's hard to answer your question without seeing what your data look like. Also, how often were your data collected - once a year, once a month, once a week, once a day, once an hour, etc.? $\endgroup$– Isabella GhementCommented Dec 4, 2018 at 3:26
-
$\begingroup$ The data is monthly inflation percentages. I've added a picture. As you can see, it looks to be downward sloping, but when I ran a Dickey-Fuller I did not find a unit root, so I am wondering if there is another way to prove non-stationarity. $\endgroup$– user222491Commented Dec 4, 2018 at 4:05
-
$\begingroup$ Did you use Dickey-Fuller test or Augmented Dickey-Fuller test? If the latter, how many lags did you include in the test and why? Check whether the PP (Phillips Perron) test confirms the result of the ADF test. The reason ADF may give you an incorrect result/different results than PP is that ADF is quite sensitive to the number of lags included. An insufficient number of lags included in the test potentially leading to serial correlation, casting doubt over the test result, whereas PP is robust to serial correlation (and heteroskedasticity) rendering its test result more reliable. $\endgroup$– ColorStatisticsCommented Dec 4, 2018 at 5:18
Add a comment
|
