0
$\begingroup$

I came across the following example from a book. I am given a dataset generated from a bivariate normal distribution:

enter image description here

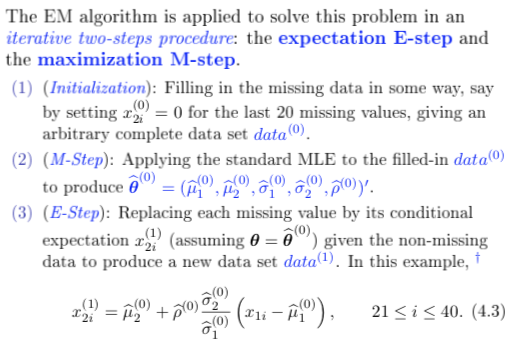
Among the data, there are missing values for the last 20 of x2i (but not for x1i). The example demonstrates how EM algorithm comes into play to impute the missing value. The procedures are attached below:

enter image description here

It is further commented that the E-step conditional expectation is derived from the following formula:

enter image description here

I don't understand how this formula (the one with epsilon) is derived. Could anyone give me a reference for that?

$\endgroup$
3
  • $\begingroup$ The quotation is puzzling because you show us equation $(4.1)$ but the explanation refers to equation $(4.3)$ which isn't shown. To give you a useful answer, we need definitions of all variables and all distributional assumptions that are being made. $\endgroup$
    – whuber
    Commented Dec 13, 2018 at 17:10
  • $\begingroup$ Thanks for pointing it out. I have supplemented the post with more information. See if it is sufficient $\endgroup$
    – yalex314
    Commented Dec 13, 2018 at 17:20
  • 1
    $\begingroup$ Thank you: your question is clearer now. I believe you can it answered in very many ways on our site: check out stats.stackexchange.com/…. I'm pretty sure I answered it at stats.stackexchange.com/a/71303/919, for instance, using elementary geometry, but of course there are many other ways to approach this. $\endgroup$
    – whuber
    Commented Dec 13, 2018 at 17:28

0