0
$\begingroup$

I'm working with UFO Sightings data set and my goal is to verify if the Shape of UFO ("circle", "cone"...) depends on the Duration of Sight (in seconds). To do that, I decided to perform a Chi-Square Independence Test, where the H0: "independant" and H1: "dependant". Code:

tab <- table(newData$durationSec,newData$shape)
chisq.test(tab, correct=FALSE)

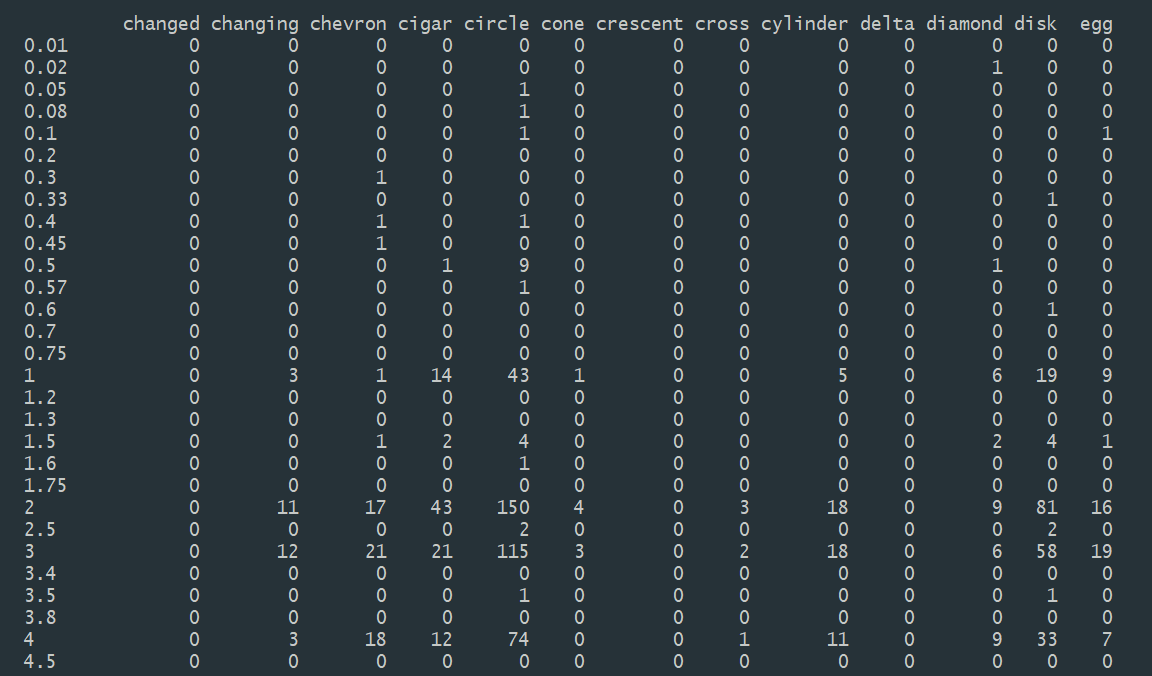
A contingency table (variable tab) is strange and I'm not sure if I'm perform the test correctly.

Some values of variable tab

And finally, the result of test:

Chi-Square Result

p-value is very small, so H0 is rejected and variable are dependant. Is is correct or something is wrong? Also, may I do the same, but for three variables? Let's suppose I want to test if Shape is depend simultaneously on the Duration (seconds) and the State (characters).

$\endgroup$
2
  • 2
    $\begingroup$ There are lots of zeros. Contingency tables like this have bad approximation to chi-squared distribution. It is in the Warning message. $\endgroup$
    – younggeun
    Commented Dec 16, 2018 at 2:14
  • $\begingroup$ Time is a continuous variable (though rounded off); you might treat it as continuous or as interval censored. It might be best to focus on the cases where there are more than a few data values and look for differences in distribution of times across the shapes. What's the real question of interest? If you're just interested in exploration you might look at cdfs, kdes or something similar. $\endgroup$
    – Glen_b
    Commented Dec 17, 2018 at 6:37

1 Answer 1

0
$\begingroup$

You have a sparse (very) table, so use simulation, as discussed in many posts, for instance Create simulation to see whether Chi Squared is suitable

But, a chisquare test is maybe not the best analysis. Your row variable is a binning of Duration of Sight (in seconds), which is a continuous variable. So, the rows are ordered, and the chisquare test does not take that into account. Ordinal regression could be a solution (search this site), but I would think that some exploratory analysis really is what you need.

So, look into visualization methods for contingency tables, stored search or maybe multivariate methods like correspondence analysis.

$\endgroup$

Your Answer

By clicking “Post Your Answer”, you agree to our terms of service and acknowledge you have read our privacy policy.

Not the answer you're looking for? Browse other questions tagged or ask your own question.