2
$\begingroup$

This may be a trivial question but I cant answer it myself.

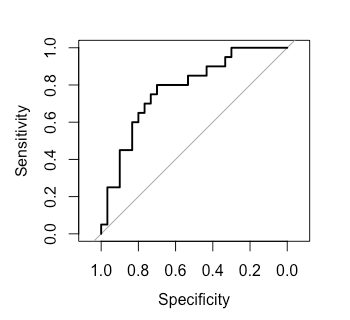
Suppose we have clinical data for patients and healthy controls. how can we draw an ROC curve in R?

set.seed(1)
patients=rnorm (20)
control= 1+ rnorm (30)

Thank you very much in advance.

$\endgroup$

1 Answer 1

3
$\begingroup$

You can use pROC library for that:

library("pROC")
my_roc <- roc(controls = control, cases = patients)
plot(my_roc)

enter image description here

$\endgroup$
0

Your Answer

By clicking “Post Your Answer”, you agree to our terms of service and acknowledge you have read our privacy policy.

Not the answer you're looking for? Browse other questions tagged or ask your own question.