4
$\begingroup$

I would like to understand the difference between the $\chi^{2}$ distribution and the Probability-To-Exceed ?

I have to compare 2 data sets A and B and in the article I am reading, they talk about this PTE :

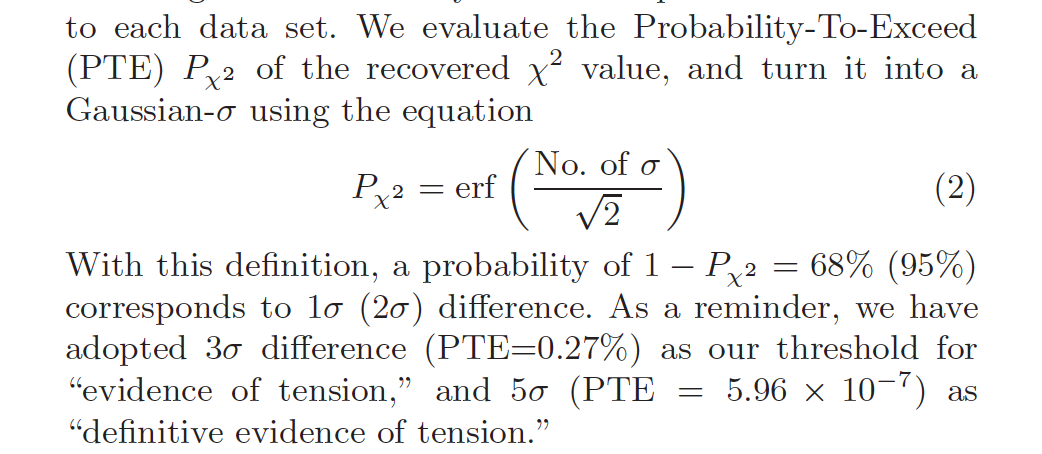
enter image description here

I only know the $\chi^{2}$ distribution with $k=2$ degrees of freedom :

$$f(\Delta\chi^{2})=\dfrac{1}{2}\,e^{-\dfrac{\Delta\chi^{2}}{2}}\quad(1)$$

and the relation with confidence level :

$$1-CL={\large\int}_{\Delta\chi^{2}_{CL}}^{+\infty}\,\dfrac{1}{2}\,e^{-\dfrac{\Delta\chi^{2}}{2}}\,d\,\chi^{2}=e^{-\dfrac{\Delta\chi_{CL}^{2}}{2}}\quad(2)$$

I don't know how to do the link with the text above.

In the article, they make appear the integral of gaussian whereas in $(2)$, I can only make appear a simple integration of exponential (I mean, there is no "$\text{erf}$" function appearing unlike into the article).

If someone could tell me the difference between $\chi^{2}$ distribution and $P_{\chi^2}$ (PTE) ?

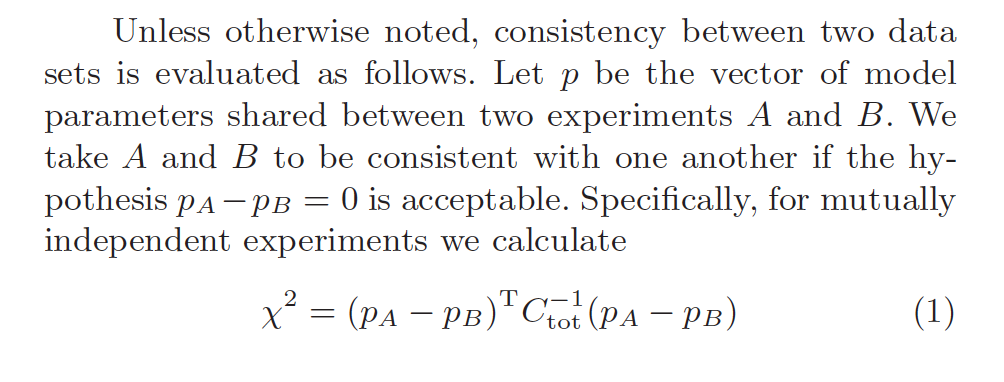
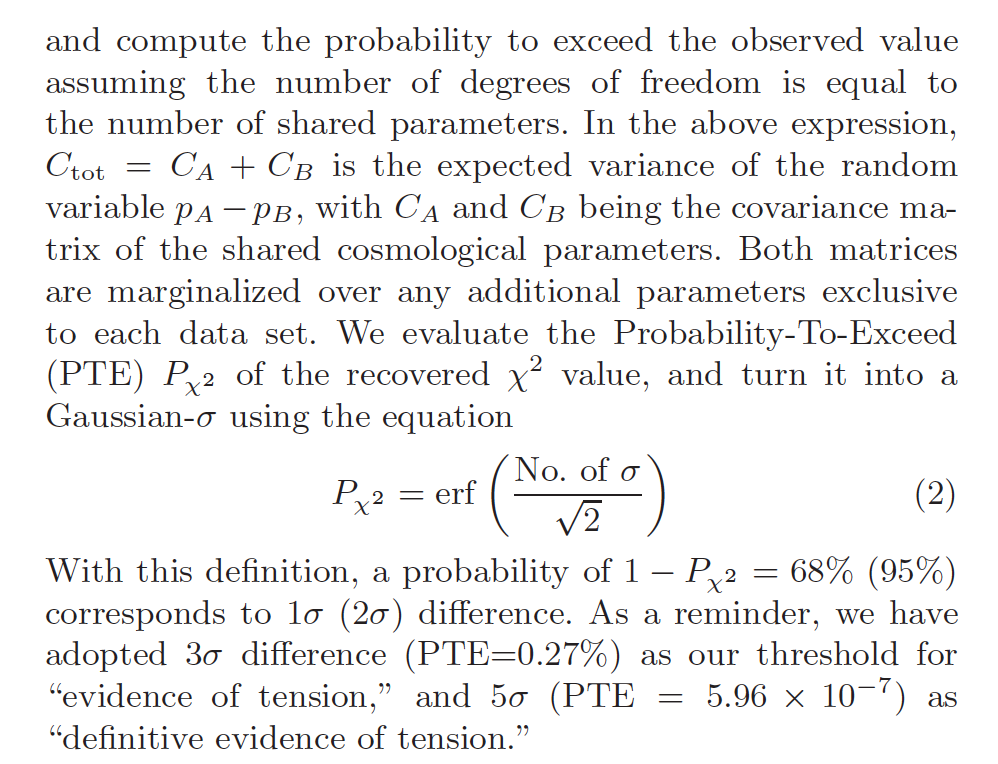
UPDATE 1: the context is about astrophysics where I have to compare the consistency of 2 data sets (cosmological parameters) . The method is described below :

enter image description here

enter image description here

Could anyone tell me what's the definition of this Probability-To-Exceed and how to determine it ?

Is it a cumulative function ? How to get the integral of a gaussian in this case (since erf appears) ?

Any help is welcome, regards

$\endgroup$
6
  • $\begingroup$ I find this quotation so unintelligible that I suppose a good answer might require referring to the original context. Please, then, tell us the source. $\endgroup$
    – whuber
    Commented Jan 3, 2019 at 21:35
  • $\begingroup$ @whuber The context is about an astrophysical context where I have to compare the consistency of 2 data sets. You can see more in my UPDATE 1 that describes the method $\endgroup$
    – user226073
    Commented Jan 3, 2019 at 23:18
  • 2
    $\begingroup$ In the citation, "the expected variance of random variable". The variance is expectation of something, so we have no expected variance. $C_A$ and $C_B$ are matrices, but $C_A + C_B$ is the variance. I think you may need to find other books/papers. $\endgroup$
    – user158565
    Commented Jan 4, 2019 at 2:29
  • $\begingroup$ @user158565 I think that $C_{tot}$ is the sum of the two covariance matrices $C_{A}$ and $C_{B}$, you don't need to focus of "the expected variance". But what it matters is to know the general method to test independant or non-correlated shared parameters between the 2 data sets with independant expriments $A$ and $B$ : I would like to grasp the subtilities of the method, especially by the formula of $\chi^{2} = (p_{A}-p_{B})^T\,C_{tot}^{-1}\,(p_{A}-p_{B})$ : how can I prove this relation ? $\endgroup$
    – user226073
    Commented Jan 5, 2019 at 23:22
  • $\begingroup$ Moreover, what does mean "the treshold for evidence of tension" for $3\sigma$ and "definitive evidence of tension" for $5\sigma$ ? It would mean that if difference between 2 data sets is greater than $5\sigma$, so it would break all previous estimations, wouldn't it ? But how to compute the "difference between 2 data sets" ? regards $\endgroup$
    – user226073
    Commented Jan 5, 2019 at 23:26

1 Answer 1

2
$\begingroup$

Instead of asking what the difference is between the two, it's clearer to ask what the relationship is between 𝜒2 distribution and the Probability-To-Exceed (PTE).

The PTE is the probability of obtaining a higher 𝜒2 than what you actually achieved. 𝜒2 is a measure of how far off your values are from expectation, and a higher value means larger disagreement. A very low PTE means it is very unlikely to get a higher 𝜒2 than what you already have, meaning your values are farther off from expectation than random chance would allow. In the opposite extreme, a very high PTE means it is very likely to get a higher 𝜒2; this is also bad because it usually means you have overestimated the errors on your measurement.

To calculate the PTE, integrate the 𝜒2 distribution up to your value of 𝜒2, and subtract that value from 1. Usually this is done via a look-up table or solved numerically with a computer program, since there is not a closed-form solution.

The quoted text then goes further, wanted to relate this PTE into a "sigma" of a gaussian distribution since that is a more commonly understood metric.

$\endgroup$

Your Answer

By clicking “Post Your Answer”, you agree to our terms of service and acknowledge you have read our privacy policy.