4
$\begingroup$

I have a question about confidence in a conversion rate. I have a sales page that had 1382 visitors, and 23 of them purchased the product. I know for that sample I had a 1.66% conversion rate. But how confident should I be that this is my actual rate? Is there a formula to help determine this?

I know if I had 5 visitors and 1 bought it'd be hard to read much into it, but I'm not sure where it switches from being too few responses to becoming something I can somewhat base future projections off of.

Thanks!

$\endgroup$

4 Answers 4

3
$\begingroup$

Provided that each visit has an equal chance of conversion and the visits are independent of one another, you could compute a (Wald) confidence interval using the formula: $$\hat{p}\pm{z_{1-\alpha/2}}\sqrt{\frac{\hat{p}(1-\hat{p})}{n}}$$

where $\hat{p}$ is the proportion in your sample, $z_{1-\alpha/2}$ is the standardized normal distribution critical value for a probability of $\alpha/2$ in each tail, $\alpha$ is the desired confidence level and $n$ is the sample size. For example if you want a 95% confidence interval then $z_{1-\alpha/2} = 1.96$ so the interval is:

$$ 0.01664 \pm{1.96}\sqrt{\frac{0.01664(1-0.01664)}{1382}}$$

$$ = (0.010, 0.023)$$

This has the interpretation that, if the sampling was repeated, then, on average, 95 times out of 100, the calculated interval would contain the true (population) value. That is, the interval will contain the true proportion with 95% probability if repeated a large number of times. A less technical interpretation is that we are 95% confident that the true population parameter is within the calculated interval.

$\endgroup$
3
$\begingroup$

We can think of the rate of visitors who purchased the product as the number of successes in an "experiment" that repeated 1382 times.

Therefore, that ratio of buyers/(total visitors) follows a binomial distribution. For 23 successes and 1382 attempts, its standard deviation can be estimated at around 4,75 (see https://en.wikipedia.org/wiki/Binomial_distribution)

About 95% of the time, you should expect results within two standard deviations of the mean, so I would build a confidence interval at around "from 13 to 32".

This means that, every 1382 visitors, you should expect between 13 and 32 purchases (in other words, between 1% and 2,3%)

I hope this helped!

EDIT NOTE: On my first answer I rushed through the calculations and made it wrong. It's done again properly and the results are now correct!

$\endgroup$
2
$\begingroup$

It seems to me that the most appropriate simple model is that there are two kinds of people: people who will and won't purchase, given that they visit. The question is what proportion of people (we're assuming an infinite population) belong to each category. That entails a binomial model. Let the proportion of the population who would purchase be $p$, the number of people who visited be $N$, and the number who bought be $R$. Then the posterior inference for $p$ is \begin{align} \mathrm{prob}(p | R, N, \mathcal{I}) &= \frac{\mathrm{prob}(R | p, N, \mathcal{I}) \: \mathrm{prob}(p | N, \mathcal{I})}{\mathrm{prob}(R | N, \mathcal{I})} \\ &= \frac{\mathrm{prob}(R | p, N, \mathcal{I}) \: \mathrm{prob}(p | N, \mathcal{I})}{\int_{p'} \mathrm{prob}(R | p', N, \mathcal{I}) \: \mathrm{prob}(p' | N, \mathcal{I}) \: dp'} \end{align}

Assigning a uniform distribution to the prior, $\mathrm{prob}(p | N, \mathcal{I}) = 1$, and the binomial distribution to the likelihood, $\mathrm{prob}(R | p, N, \mathcal{I}) = {N \choose R} p^R (1 - p)^{N - R}$, we have \begin{align} \mathrm{prob}(p | R, N, \mathcal{I}) &= \frac{{N \choose R} p^R (1 - p)^{N - R}}{\int_{p'} {N \choose R} p'^R (1 - p')^{N - R} \: dp'} \\ &= (N + 1) {N \choose R} p^R (1 - p)^{N - R} \end{align}

For $N = 1382$ and $R = 23$, this posterior looks like this:
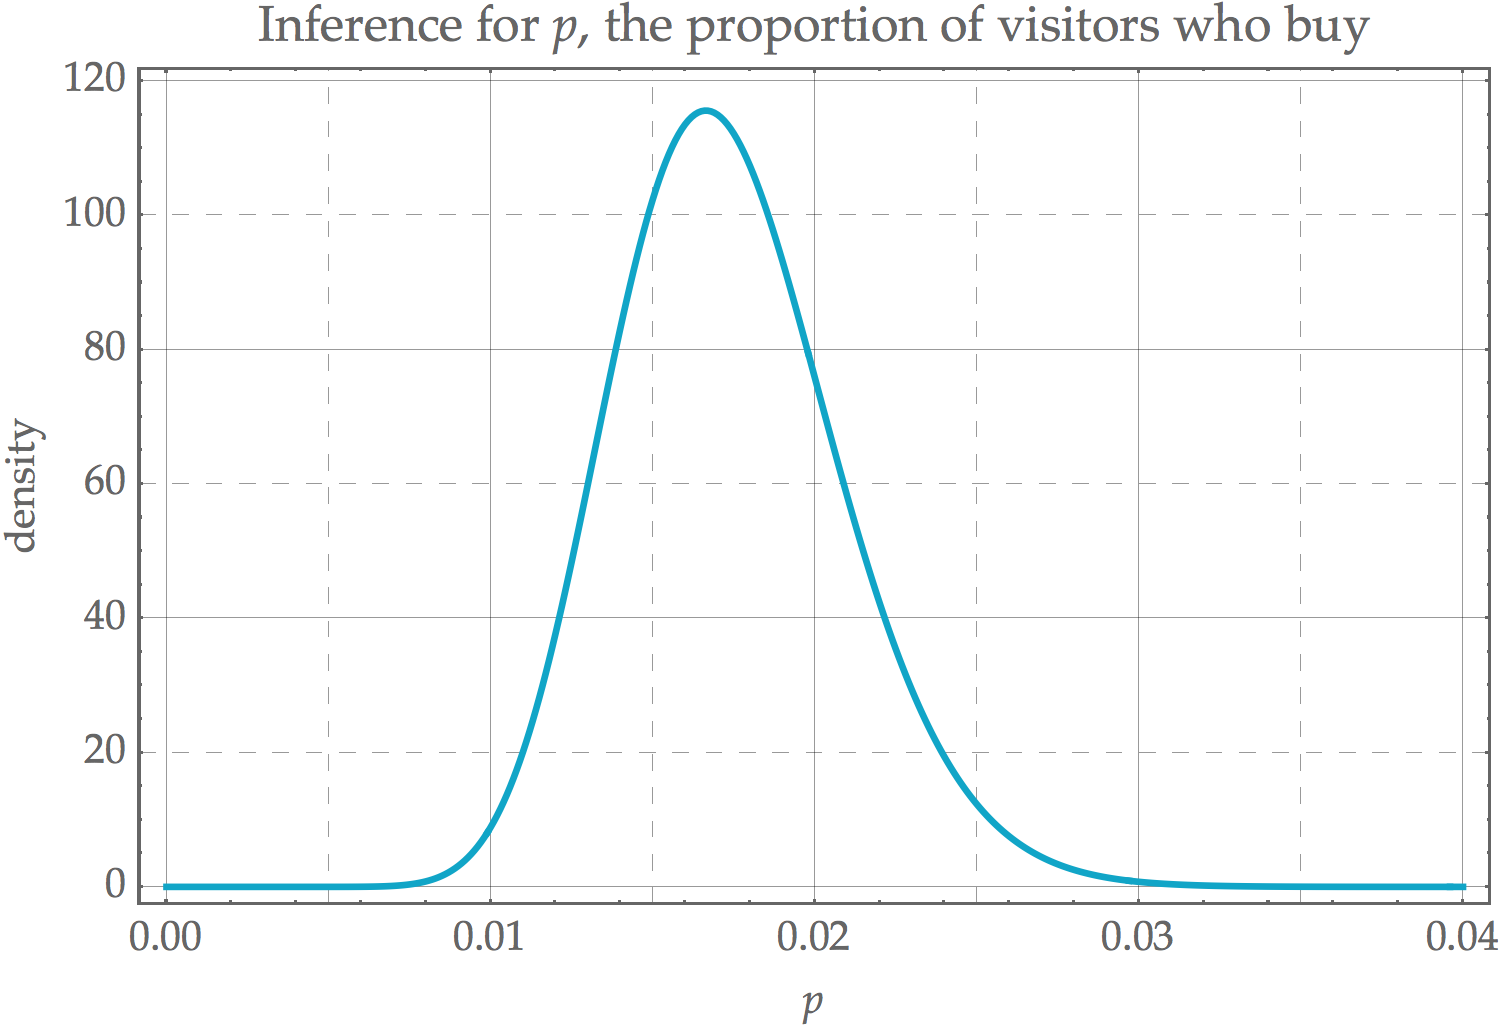
inference for p

This represents how much you now know about $p$, the proportion of the population who would buy the product, if they visited the site.

Your prediction of how many customers would buy it after visiting, given a new number of visitors $n$ and retaining what you now know about $p$ via $N$ and $R$, is another matter.

The distribution for the new number of buyers $r$ is \begin{align} \mathrm{prob}(r | n, R, N, \mathcal{I}) &= \int_p \mathrm{prob}(r, p | n, R, N, \mathcal{I}) \: dp \\ &= \int_p \mathrm{prob}(r | p, n, R, N, \mathcal{I}) \: \mathrm{prob}(p | n, R, N, \mathcal{I}) \: dp \\ &= \int_p \mathrm{prob}(r | p, n, \mathcal{I}) \: \mathrm{prob}(p | R, N, \mathcal{I}) \: dp \\ &= \int_p {n \choose r} p^r (1 - p)^{n - r} \: (N + 1) {N \choose R} p^R (1 - p)^{N - R} \: dp \\ &= \frac{(N + 1) {N \choose R}{n \choose r}}{(N + n + 1) {N + n \choose R + r}} \end{align}

Retaining $N = 1382$ and $R = 23$, and choosing a new visitor sample size of $n = 1000$, the prediction for the number of buying visitors is shown below:
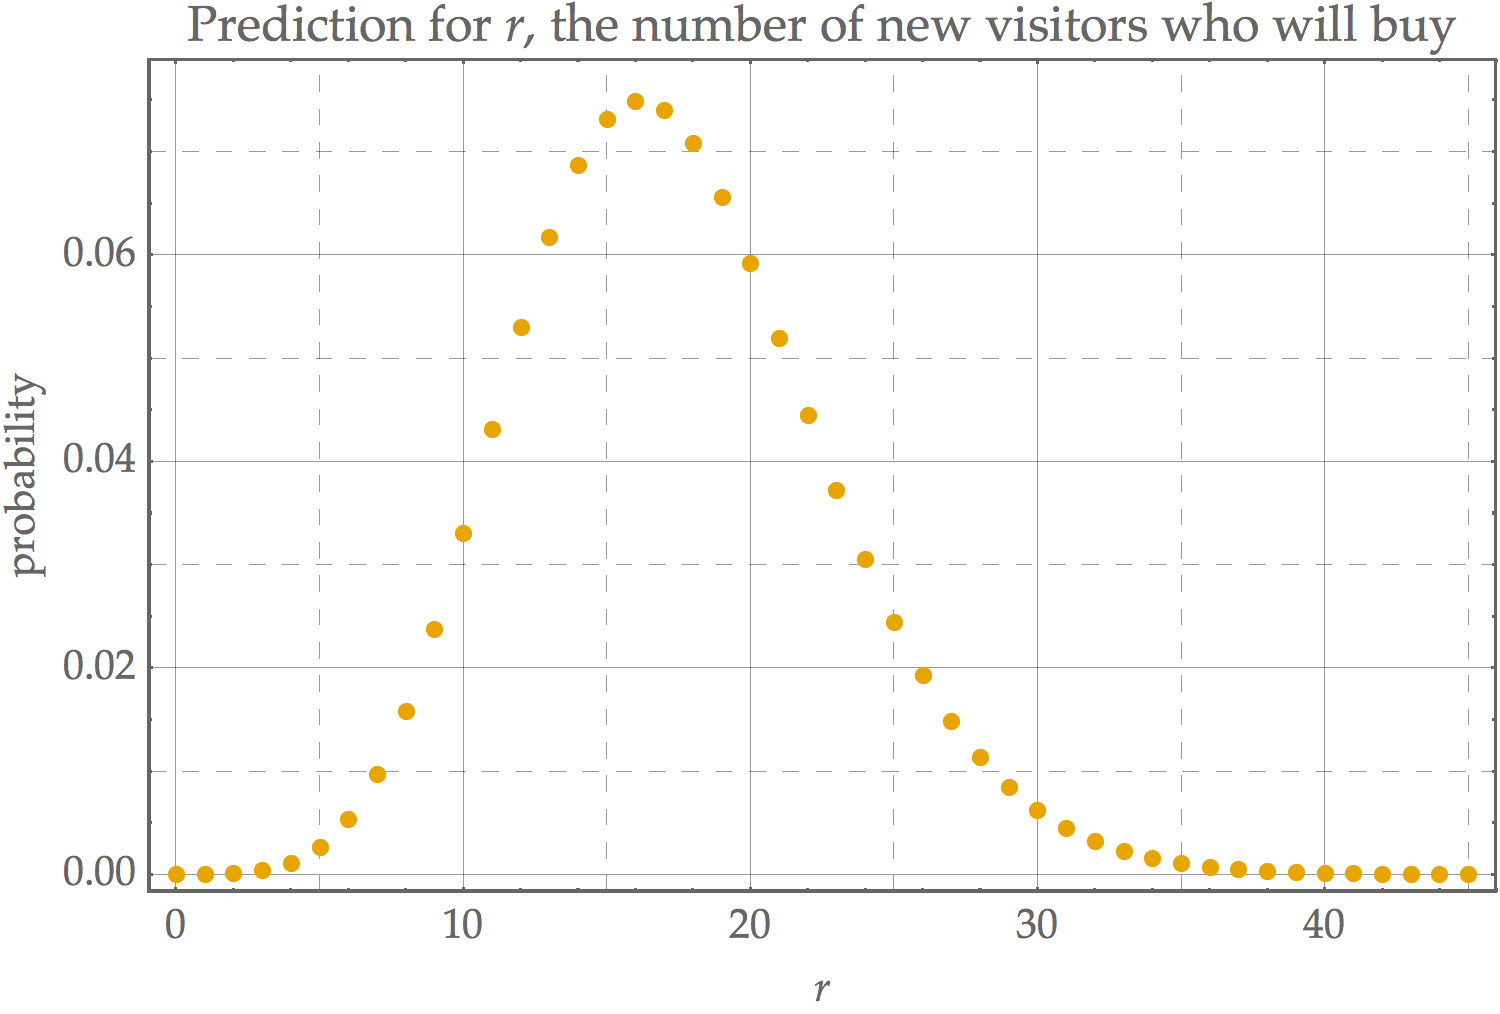
prediction for r

Note that the prediction curve is broader than the curve you'd get if you simply scaled the inference curve from $[0, 1]$ to $[0, 1000]$. This is because it incorporates the uncertainty in the number of buying visitors given a particular $p$, as well as the uncertainty in $p$.

$\endgroup$
1
$\begingroup$

You will never get the "actual" rate from estimation. But you can summarize the uncertainty in your estimate. Give a little probability model to your outcome, like saying that each page visit has an equal, independent chance of resulting in a conversion. Then you can use a binomial confidence interval to give a range of typical values for estimates if you observed another 1,382 page visits.

$\endgroup$

Your Answer

By clicking “Post Your Answer”, you agree to our terms of service and acknowledge you have read our privacy policy.

Not the answer you're looking for? Browse other questions tagged or ask your own question.