2
$\begingroup$

My specific context is detecting errors in automatic classification. Want to regularly manually review a subset of all events in one class, to ensure that the process putting them in that class is highly reliable. I’m wondering how few events I can sample and still get a solid estimate of reliability at the population level.

The method I’ve come across which so far seems most promising is Cochran’s formula. However, if I’m doing the math correctly it gives some results which seem very counterintuitive if not obviously wrong. For example, assuming 2% incidence of error and requiring 95% confidence in the conclusions, I calculate a sample size of 20 as follows.

\begin{align} n &= \frac{Z^2(p)(q)}{e^2}\\&=\frac{1.6^2(0.98) (.02) }{0.05^2}\\&= 20. \end{align}

Hard to believe that you could be highly confident about a 2% incidence in population with a sample size of 20. Using a confidence level of 98% gives a more reasonable sample size of ~200, but the tiny sample size suggested for 95% confidence makes me wonder about the method – say if there are some prerequisite assumptions for using it that I’m not aware of.

In case it's relevant, the population size in this case is tens of thousands.

Tentative plan is to use a Z Proportion Hypothesis Test on the sample after it has been manually labelled, to flag instances where we can be confident that error rate is above 2%. More fundamentally, I want to be confident that error rate is below 2% in population when less than 2% error is found in sample – that is the key requirement on sample size.

Should I use Cochran’s formula to find that sample size? Or is there a better method for this case?

$\endgroup$
8
  • 3
    $\begingroup$ You are asking for several very different things in your last few paragraphs. Ultimately, a sample size can be worked out by noting that when the population proportion is barely less than 2%, the chance you do not detect errors in a sample of size $n$ (small relative to the population) is only slightly greater than $(1-0.02)^n.$ With $n=20,$ e.g., that value is $2/3,$ obviously so great that failing to observe an error will give you little confidence errors don't exist! With a sample of $148$ that chance falls to 5%, giving you 95% chance of detecting at least one error in your sample. $\endgroup$
    – whuber
    Commented Jul 17, 2022 at 0:48
  • $\begingroup$ With these examples in mind, could you please clarify what you need to accomplish? $\endgroup$
    – whuber
    Commented Jul 17, 2022 at 0:48
  • $\begingroup$ Hi whuber. Thank you for the points and questions. $\endgroup$ Commented Jul 17, 2022 at 4:49
  • $\begingroup$ As you note, if population error rate is 2% then it is very likely that at least one error will be observed in any reasonably sized sample. I want to know what sample size is required to confidently infer population error rate from observed sample error rate. $\endgroup$ Commented Jul 17, 2022 at 4:49
  • 1
    $\begingroup$ In the example I gave, if no errors are observed in a sample of $148,$ you can be 95% confident the proportion of errors in the population is less than $2\%.$ (This exemplifies the "Rule of Three," where $148 \approx 150 = 3/(0.02).$) If you anticipate a $1.8\%$ error rate in the population, then you need to do comparable (but more complicated) calculations to determine the minimum sample size. This is called power analysis. $\endgroup$
    – whuber
    Commented Jul 17, 2022 at 16:16

3 Answers 3

1
$\begingroup$

I would like to complement @kqr's answer.

We don't plug in the (unknown) true proportion in the formula for the confidence interval, we plug in the sample proportion $\hat{p}$: it's $\hat{p} + z_{1-\alpha}\sqrt{\hat{p}(1-\hat{p})/n}$ instead of $p + z_\alpha\sqrt{p(1-p)/n}$. The sample sizes quoted by @kqr don't account for sampling variability. Of course it's hard to account for it because we only know $\hat{p}$ after we collect the data. So what can we do?

One option is power analysis as suggested by @whuber. An alternative is to plan for the desired precision of the estimate as suggested by @kqr.

I think it's more useful to plan for precision. This means to calculate the sample size to achieve a specific margin of error $\delta$. Usually the margin of error is defined as the half-length of a two-sided confidence interval. But you are interested in testing a one-sided hypothesis, so let's define the margin of error as the upper half of a one-sided confidence interval, just as @kqr does. This amounts to using $z_{1-\alpha}$ instead of $z_{1-\alpha/2}$ as the critical value.

$$ \begin{aligned} \delta = z_{1-\alpha}\operatorname{SE}/\sqrt{n} && \Leftrightarrow && n = \left(\frac{z_{1-\alpha}\operatorname{SE}}{\delta}\right)^2 \end{aligned} $$

The formula for the required sample size $n$ has three ingredients: The critical value $z_{1-\alpha}$ is a function of the significance level $\alpha$. For a sample proportion, the standard error $\operatorname{SE}$ is given by $\sqrt{\hat{p}(1-\hat{p})}$. And the margin of error $\delta$ depends on the accuracy you want to achieve; for example, you may decide you want to estimate the error rate with a 0.5% accuracy. As I already mentioned, specifying $\operatorname{SE}$ is a bit tricky. If you believe the true error rate is between 0.8% and 1.2% it's better to plug in 1.2% than 1%; this will give a slightly more conservative $\operatorname{SE}$ = 0.325 (instead of $\operatorname{SE}$ = 0.3).

alpha <- 0.05
p_se <- .012
delta <- .005

(qnorm(1 - alpha) * sqrt(p_se * (1 - p_se)) / delta)^2
#> [1] 1283.077

Power analysis also has three ingredients: the probability $\alpha$ of type I error (aka significance level), the probability $\beta$ of type II terror (power = 1 - $\beta$) and the effect size (it's a function of the difference between the true error rate and the 2% error rate you want to detect). In your question you don't commit to specific values for the a-priori error rate and the power. However, you would have to put down those numbers to make sample size calculations. There is no other way to get a "guarantee" in statistics.

Here's how to do it in R. The null hypothesis is $H_0$: p = 0.02, the alternative hypothesis is $H_1$: p = 0.01. Let's calculate the sample size for a less-than z-test for a proportion with $\alpha$ = 0.05 and power = 0.90. That is, there is 5% probability that the null is incorrectly rejected when it is true, and 10% probability that the null is not rejected when it is not true.

library("pwr")

alpha <- 0.05
power <- 0.9

p <- 0.01
q <- 0.02

pwr.p.test(h = ES.h(p, q), sig.level = alpha, power = power, alternative = "less")$n
#> [1] 1229.475

The two analyses agree that the required sample size is at least 1,200. Both "recipes" have three ingredients; the common ingredient is the significance level $\alpha$. The distinction is in what you control for in the computation: the precision of the estimate or the power of the significance test.

$\endgroup$
2
$\begingroup$

Let's say what you're asking for is the standard error of the estimation of the proportion defective, and that these can be represented as independent draws from a binomial distribution.

This standard error is $\sqrt{\frac{p(1-p)}{n}}$ where $p$ is the measured proportion defective. For 95 % one-sided confidence, we want to see a measurement at least 1.645 standard errors away from 2 %. Thus, the full equation we want to solve is

$$p + 1.645\sqrt{\frac{p(1-p)}{n}} = 0.02.$$

As you can see, the sample size required actually depends on what proportion defective you expect to find. Here are some examples:

  • p = 0.5 %, n = 60
  • p = 1.0 %, n = 268
  • p = 1.5 %, n = 1600
  • p = 1.8 %, n = 11958

As you can probably intuit, the closer the observed proportion is to 2 %, the more data you need to be really sure it's not greater than 2 %.


Note that this assumes the total population is practically infinite. You haven't specified the size exactly, but once you're sampling a significant proportion of the entire population (If you're doing non-destructive testing, anyway) you get a bonus to the standard error that's roughly the equivalent of multiplying by (N-n)/N.

However, this would only kick in once you have a really huge sample anyway, and the asymptote is still inspecting the entire population, so I'm not sure how much that helps you.


For more on this type of sampling for proportion defective, Deming wrote a lot about it in his books on sampling and statistics, as that was a big part of what he worked on.

(In particular, when doing destructive testing, depending on how lots are drawn, etc, you can have funny effects where discovering a large number of defective in the sample means there are fewer defective going to the customer.)

$\endgroup$
2
$\begingroup$

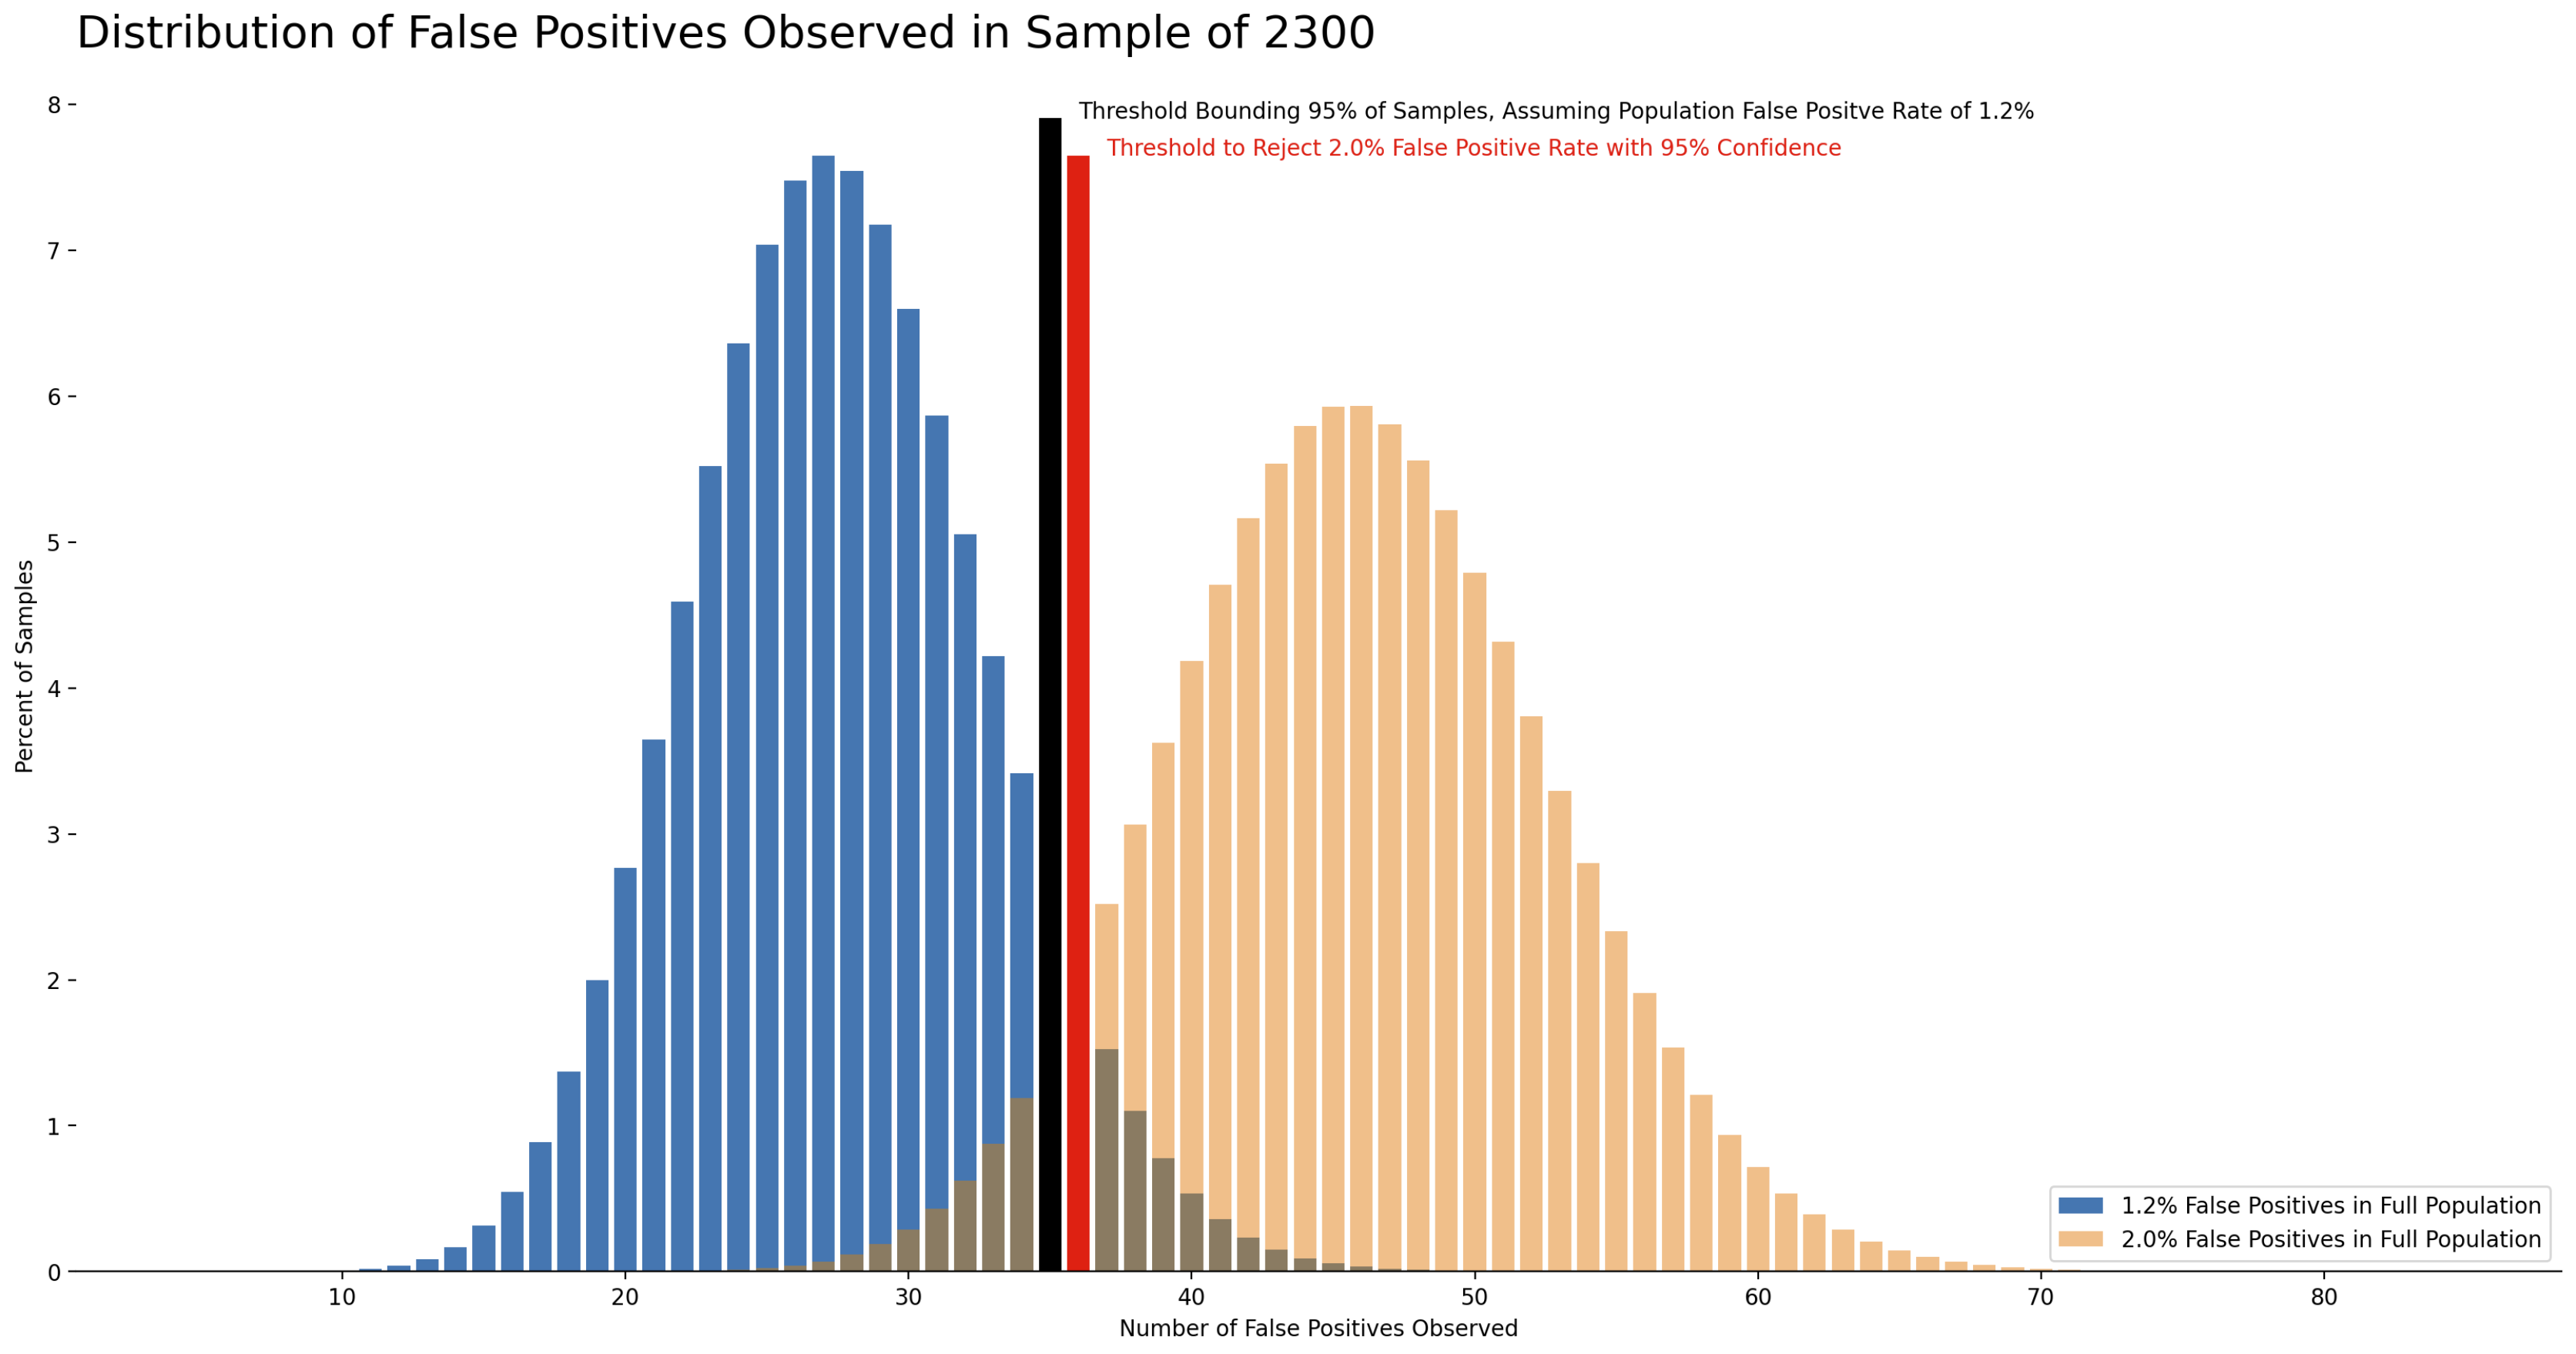
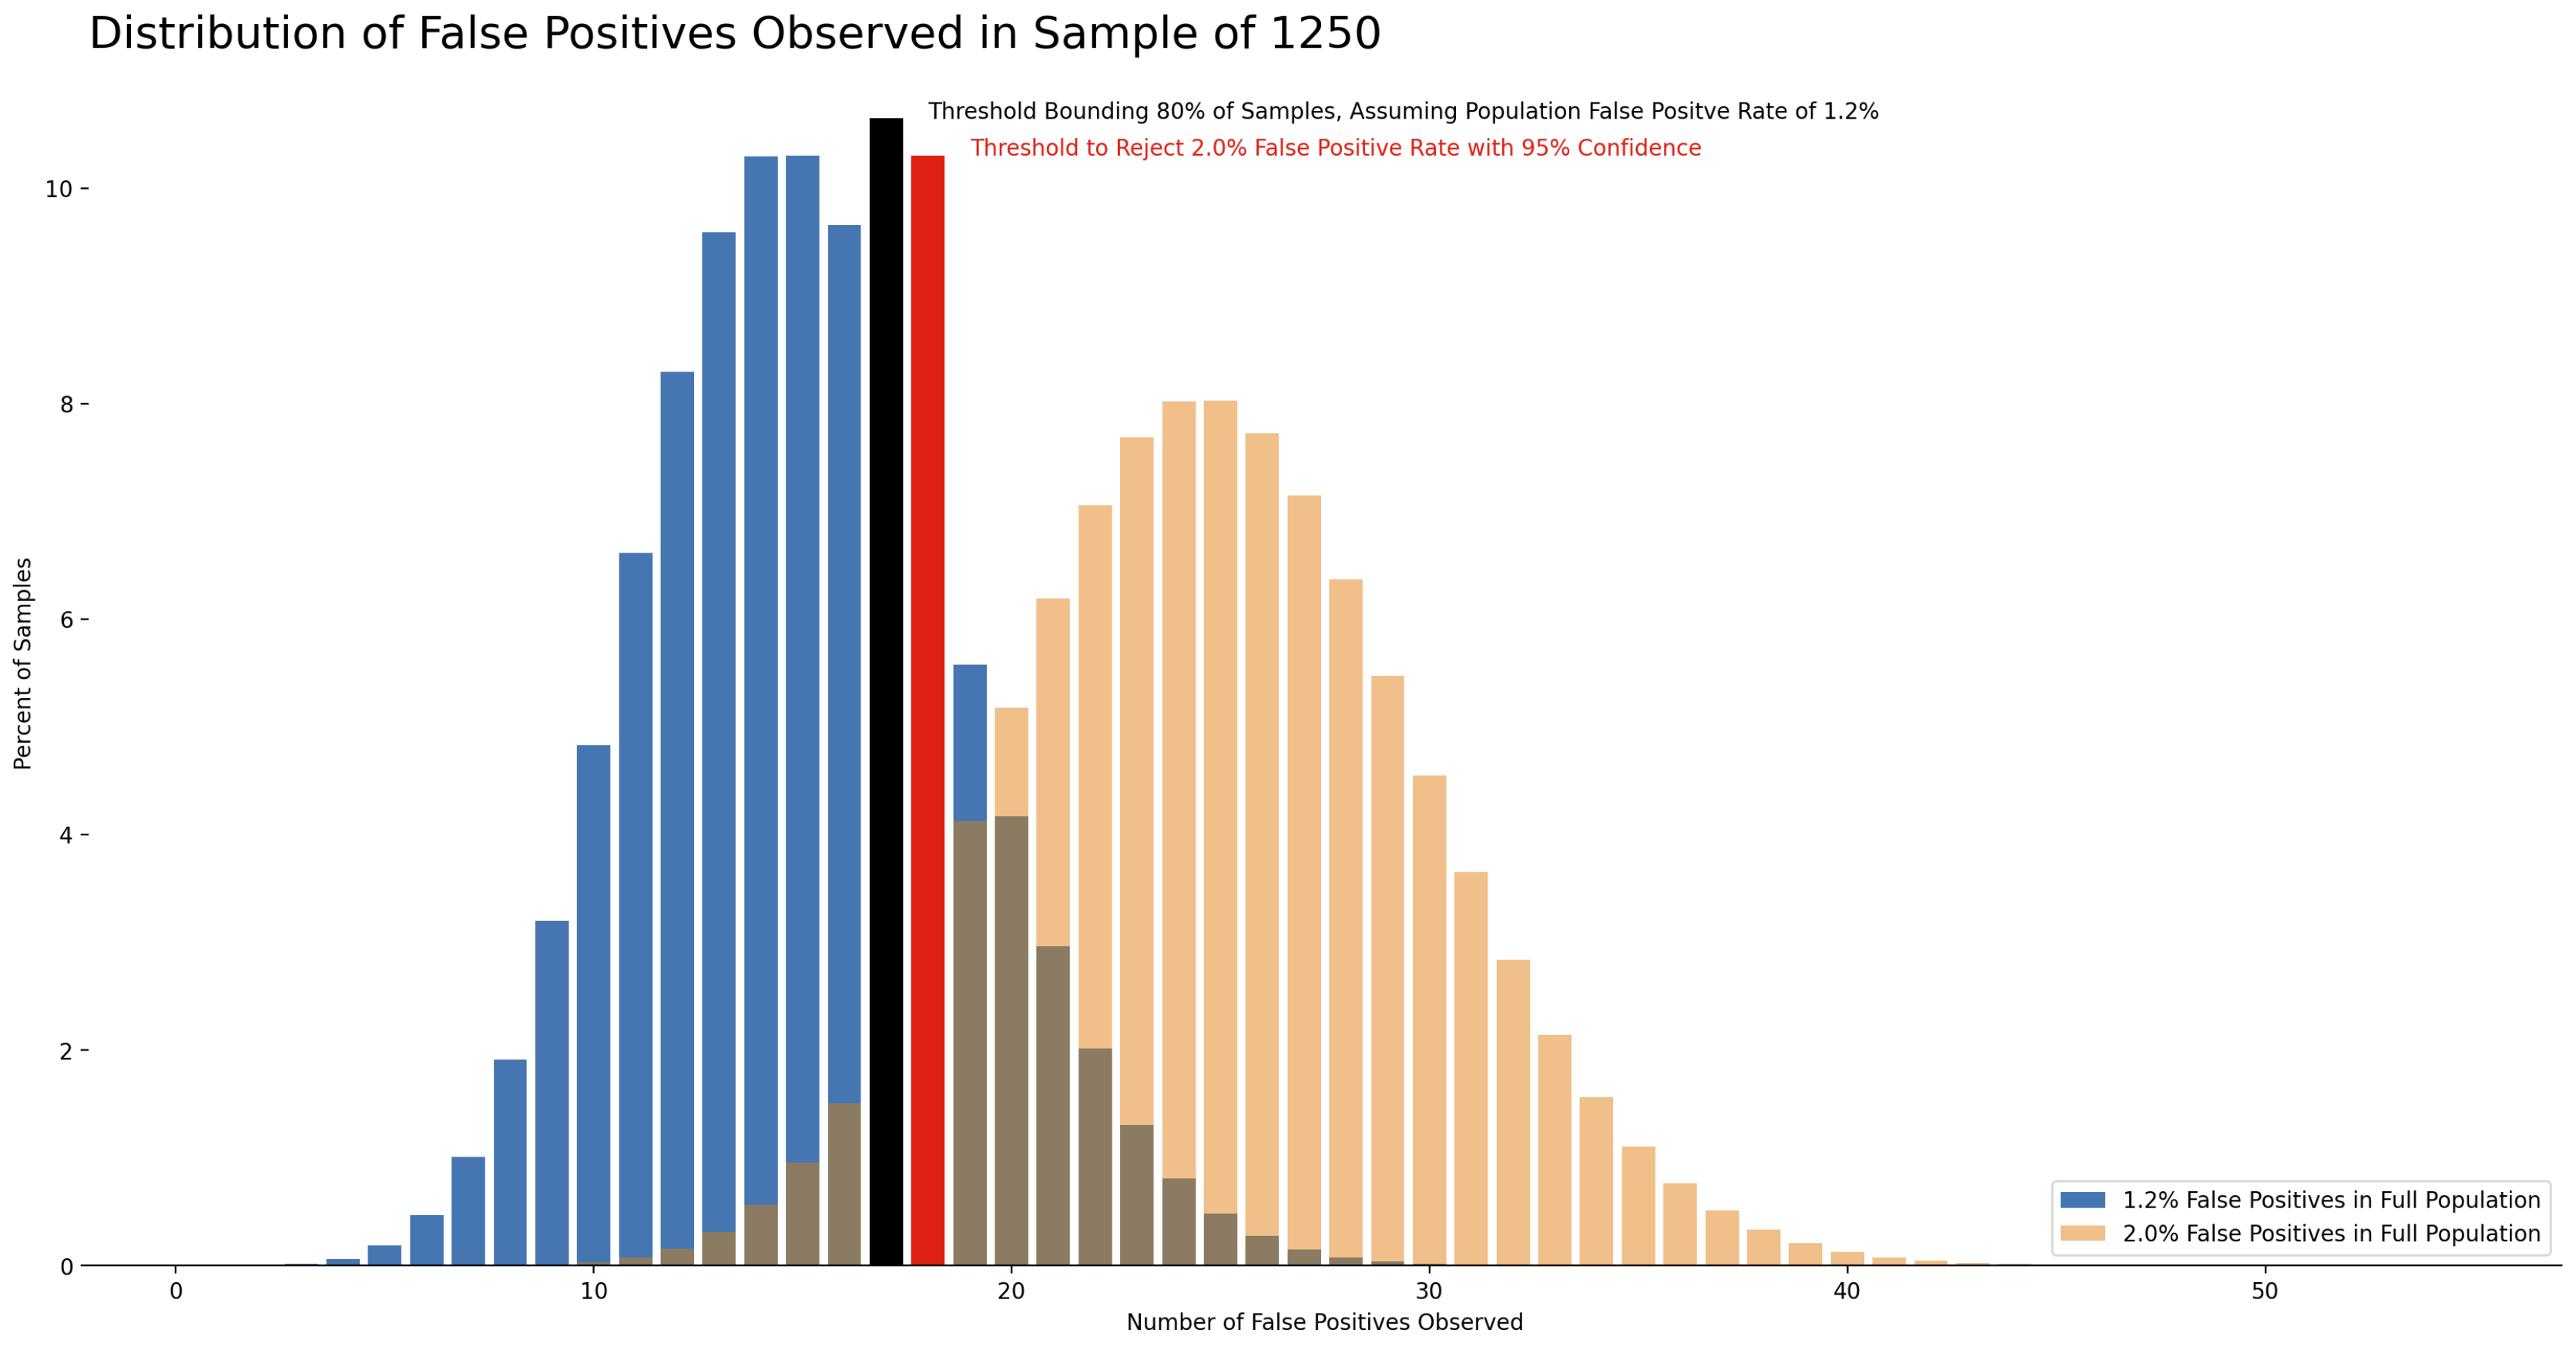
One approach is visualizing the distribution of observed sample error rate for the two population error rates of interest: the expected population error rate, and error rate which we want to guarantee population is below. By doing that for several candidate sample sizes, we can see where what sample size is required to make the distributions overlap little enough that we can consistently statistically test to reject the hypothesis that "population error rate" >= "guarantee below error rate".

This is depicted below for the expected error rate 1.2% and "guarantee error rate" 2%.

enter image description here

If the true population error rate is 1.2%, and a random sample of 1250 cases is drawn, 80% of the time it will be possible to reject the hypothesis that population error rate is >= 2%.

In fact, in my practical use case, it's not good enough to have a 20% chance of failing to correctly reject the hypothesis that population error rate is higher that "guarantee" rate. A 5% chance of failing to correctly rejected the hypothesis is more reasonable, which requires a sample size of 2300.

enter image description here

Some details on method:

  • The distributions are calculated with equation \begin{align}p_x = {sample\_size \choose x} \cdot population\_proportion^x \cdot (1 - population\_proportion)^{sample\_size - x} \end{align} where $p_x$ is the probability of observing x error cases in a sample, given sample size and population error rate.

  • The threshold bounding 95% of samples -- assuming expected population error rate -- is found by cumulatively summing the probability of each number of error cases observed in sample, and then taking the point at which that cumulative sum equals 0.95. Black line on the graphs.

  • The statistical test used was one-sided one-sample z test for proportions. The key point is largest number of error cases, less than "guarantee error rate", where p value of test is less than 0.05. Red line on the graphs.

Overall, this methodology gives the same output as power analysis, or as "planning for precision". I just found those ways somewhat like black magic when they were pure math outputting a number. To me, visualizing the relevant distributions helped with intuitively understanding why these sample sizes are adequate, so perhaps this perspective will also be useful for others.

Thank you so much to whuber, kqr, and dipetkov for explaining the considerations involved and spelling out the power analysis and "planning for precision" methods.

$\endgroup$

Your Answer

By clicking “Post Your Answer”, you agree to our terms of service and acknowledge you have read our privacy policy.

Not the answer you're looking for? Browse other questions tagged or ask your own question.