1
$\begingroup$

Question

What is the likelihood function for the event where 8 heads observed after 10 coin tossing?

Is below in Python/Scipy using (scipy.stats.binom) correct?

likelihood = []
for i in range(11):
    likelihood.append(binom.pmf(n=10,k=i,p=0.8))

For example, suppose the current probability distribution has the mean = 5 (fair coin/5 heads out of 10 toss). Then the Bayesian update will be:

likelihood = []
for i in range(11):
    likelihood.append(binom.pmf(n=10,k=i,p=0.8))

# first is prior, second is posterior
second = np.multiply(first, likelihood)
second = second / np.sum(second)    

Is this correct?

enter image description here

Background

(I used 8 heads out of 10 above but the example below uses 4 heads out of 10. It was simply because 8 heads to 10 was far away from the prior. Apology for the confusion.)

Introduction to Bayesian statistics, part 1: The basic concepts says that Bayesian regression posterior is prior x likelihood and normalisation, and the likelihood function for coin toss is binominal(10, 4, $\theta$) for 4 heads out of 10 toss. enter image description here
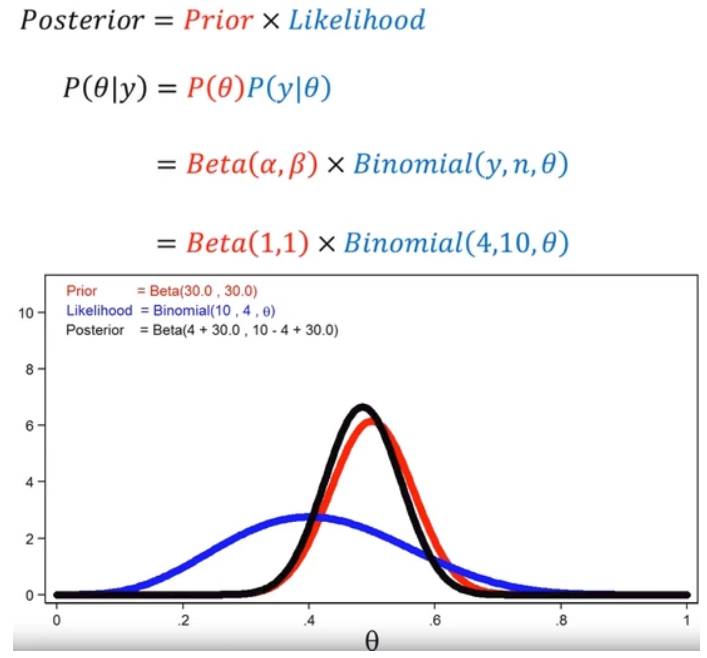
I am not clear about the $p(y|\theta)$. I think it is the probability distribution for the event y (4 heads out of 10) to happen under some condition $\theta$, but what is $\theta$? Kindly explain what $\theta$ and $p(y|\theta)$ are in simple layman's English without mathematical formulas. In a way a grand-ma can understand.

As the event of 4 heads out of 10 toss to happen will be independent from the prior events, I suppose the likelihood function will be the binomial distribution of the coin that has 40% chance to have head at 10 coin toss.

Is this correct? If not, please explain why and how to get $p(y|\theta)$.

Code (Jupyter notebook)

import math
import numpy as np
from scipy.stats import binom

import statsmodels.api as sm
import matplotlib.pyplot as plt

%matplotlib inline


x = np.linspace(0, 10, 11)
y = [0] * len(x)

fig, ax = plt.subplots(1, 3,sharex=True,sharey=True)
fig.set_size_inches(20, 5)
# 

# --------------------------------------------------------------------------------
# First
# 5 heads out of 10
# --------------------------------------------------------------------------------
first = []
for i in range(11):
    first.append(binom.pmf(n=10,k=i,p=0.5))

ax[0].grid(
    color='lightblue',
    linestyle='--',
    linewidth=0.5
)    
ax[0].plot(
    [5],
    [0],
    linestyle="None",
    marker='o',
    markersize=10,
    color='r'
)
ax[0].vlines(x=x, ymin=0, ymax=first, colors='b', linestyles='--', lw=2)
ax[0].set_title('Initial 5 out of 10 toss')

# --------------------------------------------------------------------------------
# First + Second likelifood overlay
# Likelifood for having had 8 heads out of 10
# --------------------------------------------------------------------------------
ax[1].grid(
    color='lightblue',
    linestyle='--',
    linewidth=0.5
)
ax[1].plot(
    [5, 8],
    [0 ,0],
    linestyle="None",
    marker='o',
    markersize=10,
    color='r'
)
likelihood = []
for i in range(11):
    likelihood.append(binom.pmf(n=10,k=i,p=0.8))

ax[1].vlines(x=x, ymin=0, ymax=likelihood, colors='r', linestyles='-', lw=2)
ax[1].vlines(x=x, ymin=0, ymax=first, colors='b', linestyles='--', lw=2)
ax[1].set_title('8 out of 10 toss observed')

second = np.multiply(first, likelihood)
second = second / np.sum(second)

# --------------------------------------------------------------------------------\
# Posterior
# --------------------------------------------------------------------------------
ax[2].grid(
    color='lightblue',
    linestyle='--',
    linewidth=0.5
)
ax[2].plot(
    [5, 8],
    [0 ,0],
    linestyle="None",
    marker='o',
    markersize=10,
    color='r'
)
ax[2].vlines(x=x, ymin=0, ymax=second, colors='k', linestyles='-', lw=1)
ax[2].set_title('5 and 8 out of 10 toss')

plt.show()
$\endgroup$
0

2 Answers 2

1
$\begingroup$

No, the code is not correct. The likelihood function for "the event where 8 heads observed after 10 coin tossing" is the binomial distribution with $n=10$ and unknown probability of success $\theta$:

$$ y \sim \mathsf{Binom}(n=10,\, p=\theta) $$

this is your $p(y|\theta)$. Notice that this already is a distribution of all the tosses, not a single toss.

In your code you used binom.pmf(n=10,k=i,p=0.8), so you assumed (or knew) $p$ to be $0.8$. This is not a likelihood, but rather a distribution of $y$ when all the parameters are known. Alternatively, maybe you wanted to show likelihood function evaluated on $p=0.8$ value, then this is the case.

Likelihood is a distribution of the data given the parameter $\theta$. Prior is the distribution of the unknown parameter $\theta$ that is assumed a priori, before seeing the data. In your code the first is, incorrectly, also a binomial distribution. The most common, "textbook", prior for $\theta$ is the beta distribution:

$$ \theta \sim \mathsf{Beta}(\alpha, \beta) $$

this is $p(\theta)$. Notice that $\theta$ can be any real number in $[0, 1]$ interval (it is a probability), so the Bayes theorem is

$$ p(\theta|y) = \frac{p(y|\theta)\,p(\theta)}{\int_0^1 p(y|\theta)\,p(\theta)\, d\theta} $$

So in the denominator you cannot list all the possible values and sum, since there is infinite number of possible values for $\theta$. You need to take integral, that is why we use simulation-based approaches as MCMC, to approximate those integrals.

There is also a mathematical shortcut, since beta distribution is a conjugate prior for $p$ parameter of the binomial distribution, there is a closed-form solution and the posterior distribution is available right away as

$$ \theta|y \sim \mathsf{Beta}(\alpha+y,\,\beta+n-y) $$

this is $p(\theta|y)$.

$\endgroup$
6
  • $\begingroup$ Thanks @Tim, so θ in p(θ), p(y|θ) is same with the mean of MLE which is calculated using all the same data to get the prior? $\endgroup$
    – mon
    Commented Apr 25, 2019 at 23:38
  • $\begingroup$ As in wiseodd.github.io/techblog/2017/01/01/mle-vs-map, it looks if the initial prior is uniform (alpha=beta=1), then it can be handled in the context of MLE. $\endgroup$
    – mon
    Commented Apr 26, 2019 at 1:36
  • $\begingroup$ @mon likelihood in MLE and Bayesian likelihood are technically same thing, but conceptually different, see stats.stackexchange.com/questions/224037/… With uniform prior $p(\theta) \propto 1$ you will get same results for MLE and MAP because it reduces to $\text{likelihood} \times 1$. $\endgroup$
    – Tim
    Commented Apr 26, 2019 at 6:58
  • $\begingroup$ sorry again, binom.pmf(n=10,k=8,p=𝜃) for all 𝜃 is the likelihood function? $\endgroup$
    – mon
    Commented May 13, 2019 at 15:18
  • $\begingroup$ @mon binom.pmf(n=10,k=8,p=𝜃) as a function of 𝜃, so rather for "some" theta, then for "all" theta. $\endgroup$
    – Tim
    Commented May 13, 2019 at 15:28
2
$\begingroup$

I do not see the link here to regression, what you describe is simple posterior distribution calculation.

Is below in Python/Scipy using (scipy.stats.binom) correct?

Yes, you implementation using scipy.stats.binom seems correct.

Kindly explain what θ and p(y|θ) are in simple layman's English without mathematical formulas. In a way a grand-ma can understand.

In probability theory and statistics, the binomial distribution with parameters $n$ and $θ$ is the discrete probability distribution of the number of successes in a sequence of n independent experiments, each asking a yes–no question, and each with its own boolean-valued outcome: success/yes/true/one (with probability $θ$) or failure/no/false/zero (with probability $q = 1 − θ$). Check out the Wikipedia link.

$p(y|θ)$ is the likelihood function, in this case following a binomial distribution as per above. Check this answer out for more information. Here $y$, or sometimes $D$ corresponds to the sample set.

Is this correct? If not, please explain why and how to get p(y|θ).

I assume you mean the posterior: $p(θ|y)$ since you have already calculated the likelihood: $p(y|θ)$ with the scipy.stats function. As for the code, you are not incorporating the prior distribution (beta) here if I read it correctly. Check out this great answer. Following that I am hoping it will become clear that you can calculate the $numerator = beta * binomial$ by using the scipy.stats.binom as the priors in this case can be represented as fictitious $H$ or $T$ observations you inject to the binomial formula.

$\endgroup$

Your Answer

By clicking “Post Your Answer”, you agree to our terms of service and acknowledge you have read our privacy policy.

Not the answer you're looking for? Browse other questions tagged or ask your own question.