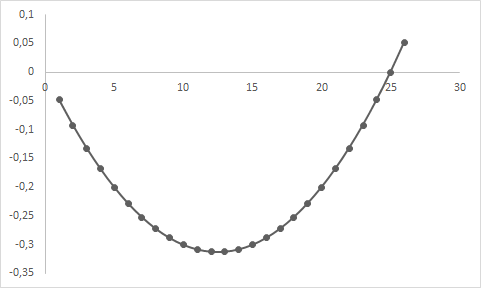
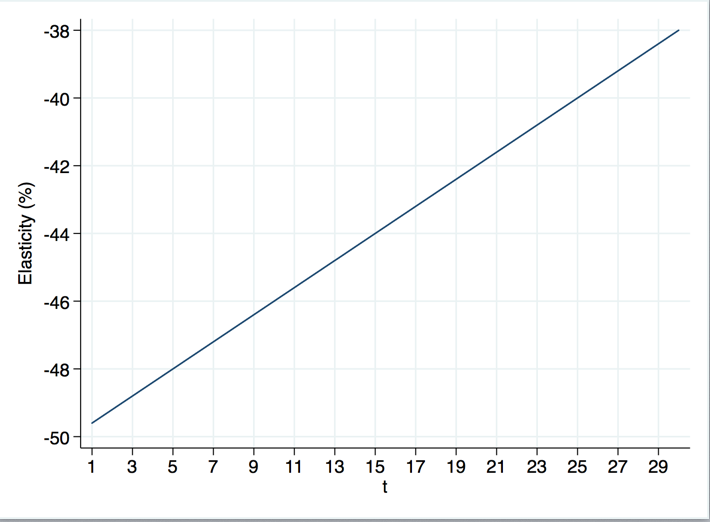
I want to estimate price of a product, lets say a boat, over time - panel data model.
I estimated a model where I control for number of characteristics denoted as $X$ ( e.g. engine size, weight etc.). However, I also included a trend and trend squared variable into the model to control for "other" market developments. Let's just assume that is correct specification for now.
$ln(price_i) = \alpha_i + \beta_i\sum X + \gamma_i~trend + \delta_i ~ trend^2$
My estimated coefficients for $\gamma$ is negative (-0.5) and $\delta$ positive (0.002). This indicates that the initially price is decreasing with time but after around 13 years the trend reverts (convex shape).
My question is how do I interpret the coefficients (ceteris paribus), meaning I know that per one unit increase in trend (year) there is approx. $-0.048 \approx (1- e^{-0.05})*1 + (1-e^{0.002})*1^2$ change in price in year 1, $-0.092$ in year 2, $...$, $-0.092$ in year 23, $...$, etc. However, is it change in price relative to "year 0" or year-to-year change? In short how I would label the y-axis on the plot above, would %$\Delta$ Price be correct?


