1
$\begingroup$

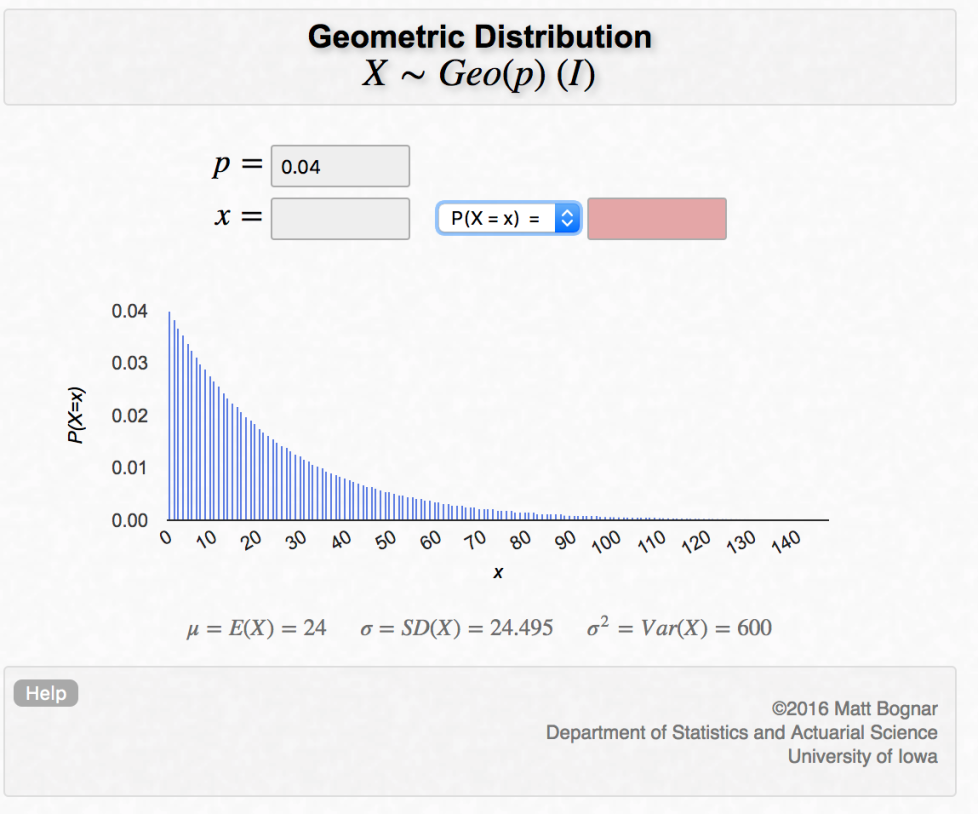
I was looking into geometric distributions to find the probability of the first success of some random variable X. So if p = 0.04, the geometric distribution looks something like this:

enter image description here

I understand the graph mathematically from the probability formula, but it seems kind of unintuitive for the chance of first success being x to keep going down, since I wouldn't expect getting a success on the first try to have the highest probability with p = 0.04.

So if I run an experiment with a random number generator with chance of success = 0.04, and record the trial in which I get my first success and plot it on a graph, would it be expected to look something like the above distribution, where getting a success on the first try would be the most common event?

$\endgroup$
1
  • 1
    $\begingroup$ Probability is strange, so we need to calibrate our intuitions by analyzing simple situations like this. Consider that if you don't have a success on the first try, you're back where you began. This happens 96% of the time, so as a result your chance of a success on the second overall try is 96% of the chance of getting a success on the first try, etc. $\endgroup$
    – whuber
    Commented Jul 16, 2019 at 22:42

1 Answer 1

1
$\begingroup$

As whuber notes, to succeed on the second trial, you must fail and then succeed. To succeed on the first trial you need only succeed -- and both successes happen with the same probability, so success on the second trial is less probable than the first.

Yes, if you simulate this process you should see something like the probability function you have shown (plus some variation due to random noise). The larger the simulation, the more the sample proportions should reflect the population proportions.

$\endgroup$

Your Answer

By clicking “Post Your Answer”, you agree to our terms of service and acknowledge you have read our privacy policy.

Not the answer you're looking for? Browse other questions tagged or ask your own question.