1
$\begingroup$

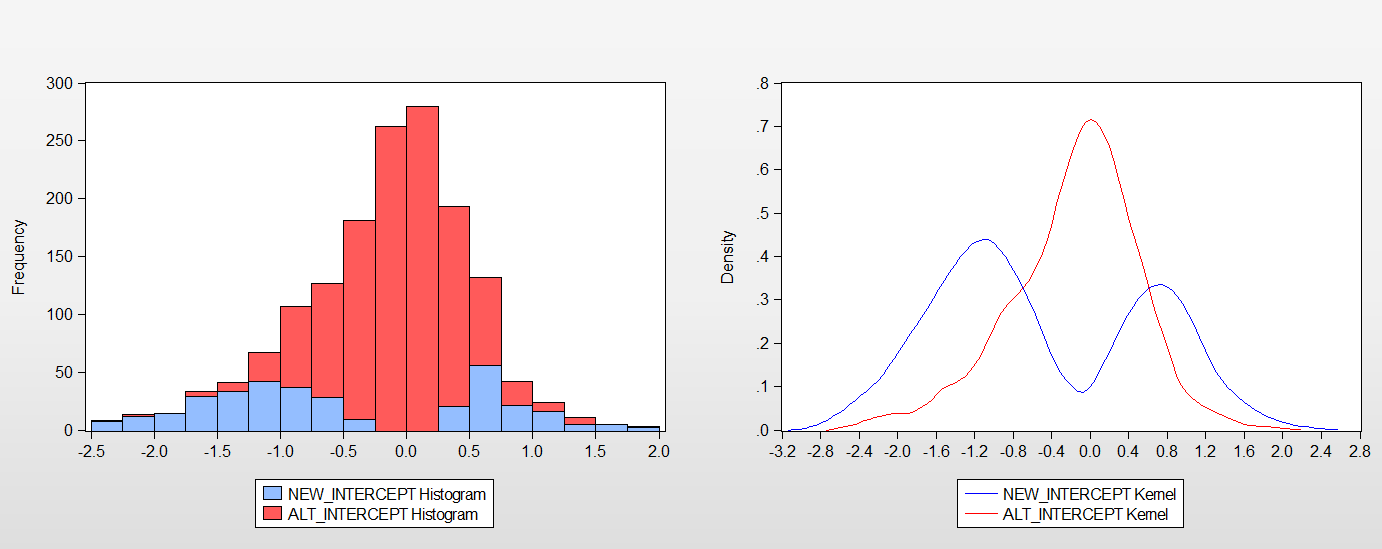
I have a series that is 1500 observations long called alt_intercept. From it, I created a subset that contains values only if another series (called pvalue) is less than .2 and it has NAs for all other values (so the length is still 1500). This is the convention for creating subsets in my statistics suite. The subset is called new_intercept.

enter image description here

Question

Why does new_intercept appear to have longer tails than the series it was made from in the kernel density plot? Surely it should be bound by the series it was recoded from??

$\endgroup$
1
  • $\begingroup$ You're selecting those coefficients with small p-values and then smoothing those with a KDE? Those would naturally be more spread $\endgroup$
    – Glen_b
    Commented Jul 19, 2019 at 3:53

1 Answer 1

1
$\begingroup$

The KDE works with a kernel, and Gaussian is a common choice, probably the one you're using here. You can think this process as putting Gaussians on your data points, summing and normalizing them. Surely, you'll have different bounds than your data, because in the endpoints of your data, you'll have right and left tails in most kernels. If number of points near the ends is large, the tails will be stronger; if not, the tails will be weak and you won't realize the volume under it. The new_intercept has more focus on the endpoints compared to alt_intercept, therefore KDE tails will be stronger and your data range is going to seem larger.

$\endgroup$
2
  • $\begingroup$ I'm not sure I understand. Suppose I looked at the left tail, specifically the range -3.2 to -2.8 on the kernel curve and calculated the AUC, that gives me a probability (though small), whereas on the LHS normal histogram, I don't see any values between -3.2 to -2.8 at all. $\endgroup$ Commented Jul 19, 2019 at 6:43
  • $\begingroup$ For example, let's say you have just one point of data. You don't have any range, you have just one point. KDE puts a Gaussian over your point, and assumes a density in the neighborhood of it. Now, you'll have volume under the PDF in the intervals where the data doesn't exist. Just like that, it's perfectly fine that you'll have small AUC between -3.2 and -2.8. $\endgroup$
    – gunes
    Commented Jul 19, 2019 at 6:57

Your Answer

By clicking “Post Your Answer”, you agree to our terms of service and acknowledge you have read our privacy policy.

Not the answer you're looking for? Browse other questions tagged or ask your own question.