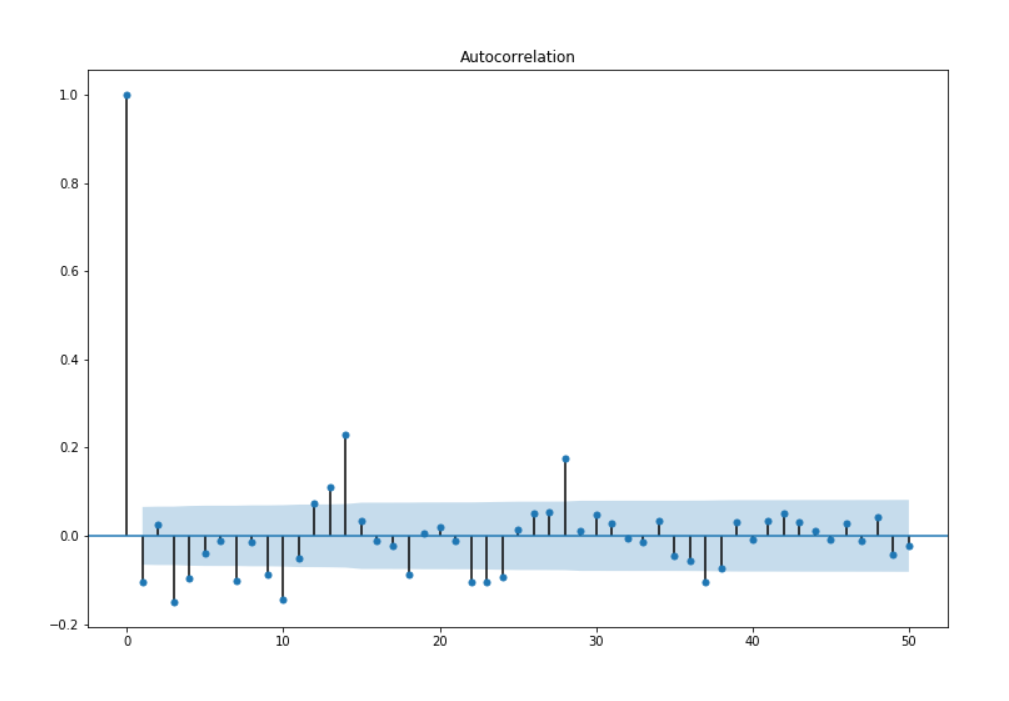
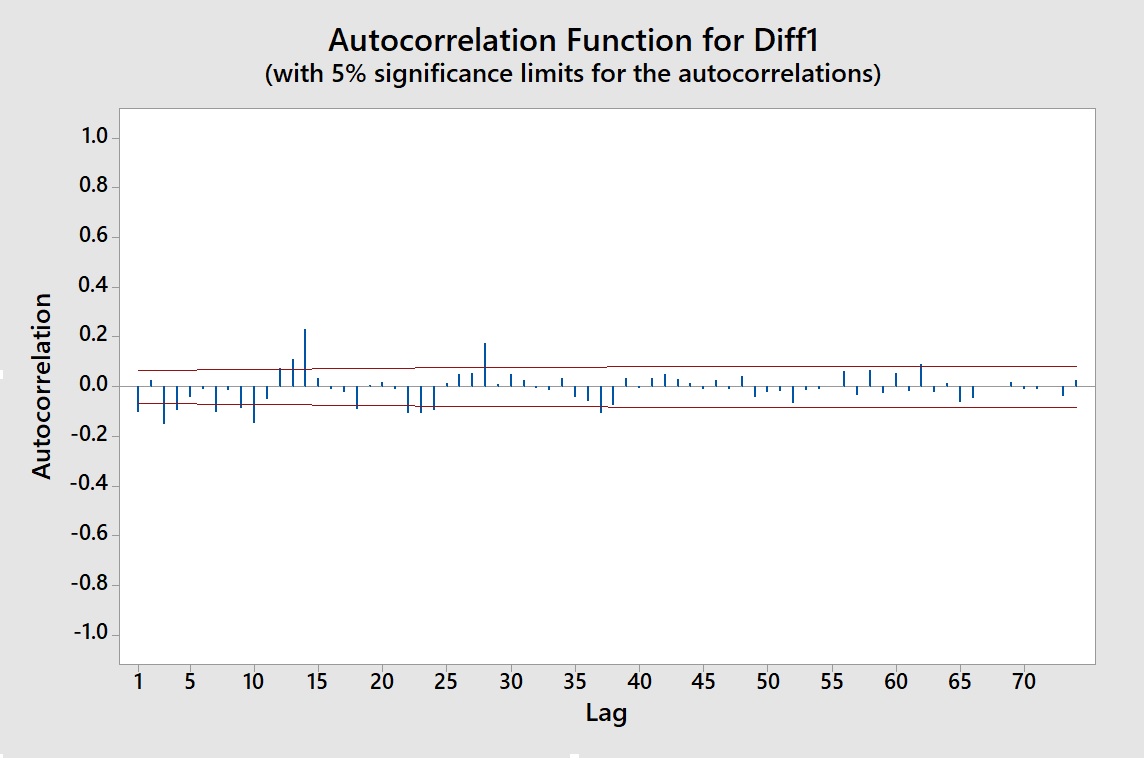
A time series can be said to be stationary when the mean , standard deviation and auto-correlation is the same for all sub-intervals of time. If you have Pulses,Seasonal Pulses, Level Shifts or Local Time Trends this would be a violation of the stationarity of the mean. If the standard deviation changes over time for example dependent on the mean then this would be a violation of the assumption of a constant standard deviation. If the auto-correlation function changes over time then this might be an indication of time varying parameters BUT it could have other causes.
One form of adjustment to make a series stationary is to de-mean the data ie. adjust for a changing mean
Another form is to adjust for pulses and seasonal pulses
Another form is to difference the data either regularly or seasonally or both
Another form is to transform the data based upon a box-cox analysis
Another form is to apply weights to standardize (make common) the error variance over time
Only your data knows for sure . Ask your data which transform is appropriate for your data i.e. test for the appropriate stationarity transform
EDITED AFTER RECEIPT OF YOUR DATA:
Expanding on the @davo note that a time series with seasonality OR level/step shifts OR monthly effects OR daily effects OR local time trends OR time-varying parameters or time-varying error variance cannot be stationary. Indeed, as stationarity means that that the properties of a series are independent of time, and because a time series with one or more of these features by its very nature depends on time, thus they are ipso facto non-stationary.
Your 894 daily values are here (starting 1/1/2013) 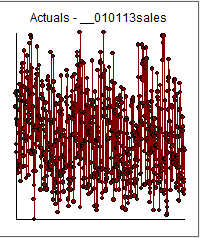
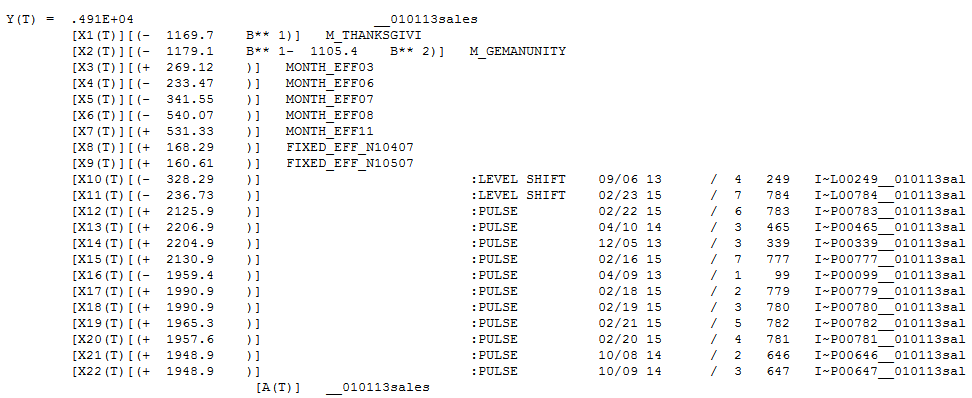
A useful model was found that has two step/level shifts down (9/6/2013 & 2/23/2015) , 5 monthly indicators (seasonal factors : March & November + ; June, July & Aug -) , 2 day of-the-week factors (sluggish sales on the weekends) and two holiday effects around Thanksgiving and German Unification Day and a few unusual values (pulses).
The Actual/Fit and Forecast graph is here 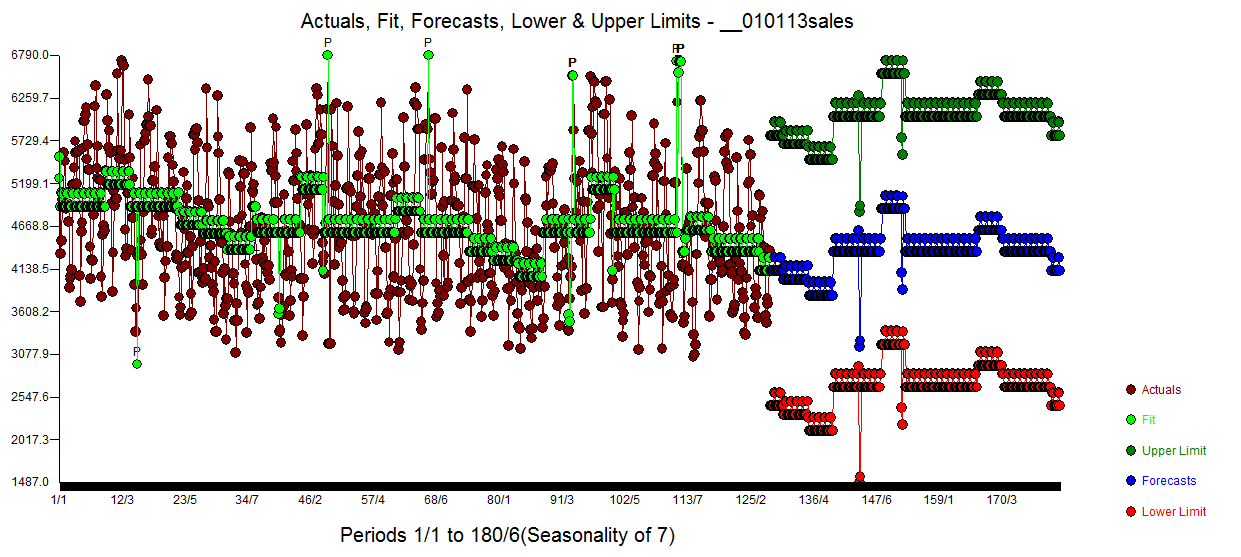 with forecasts here for the next 365 days
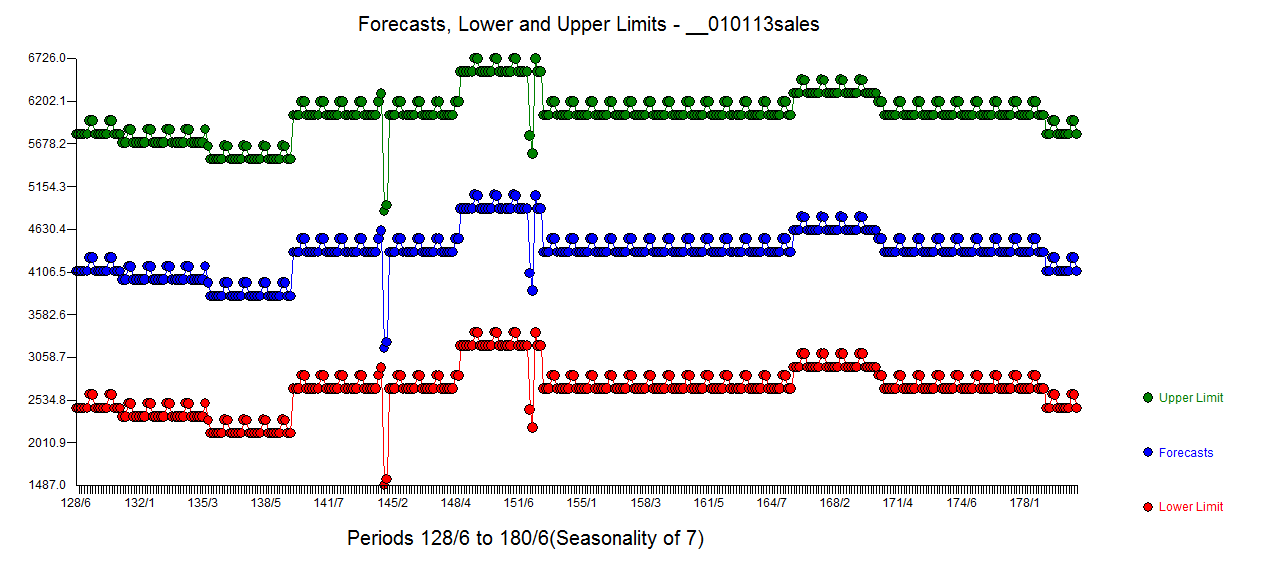
The Actuals and Cleansed Graph is here 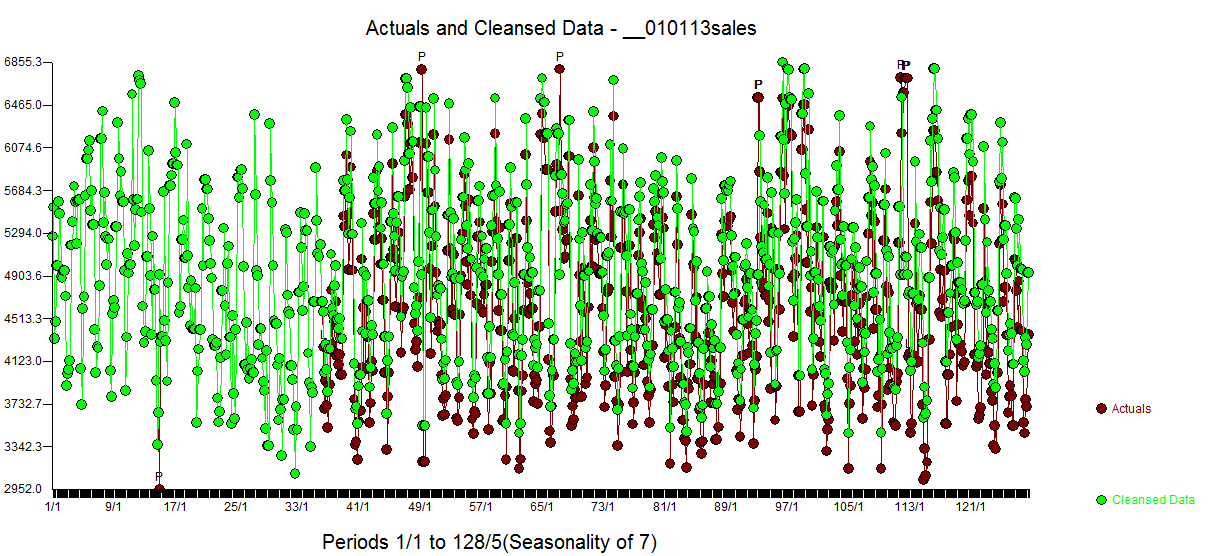
Note that the data has a weekly( day-of-the-week) seasonality BUT it is not memory driven as @davo suggested needing sarima (stochastic structure) BUT one driven by exceptional repetitive/consistent/deterministic/repetitive activity on Saturday & Sunday. Thus since Saturday is always high because it is a Saturday this falsely suggests that the previous Saturday is important. Same for Sunday . Five days of the week have no predictable information.
Following is the plot of the model residuals 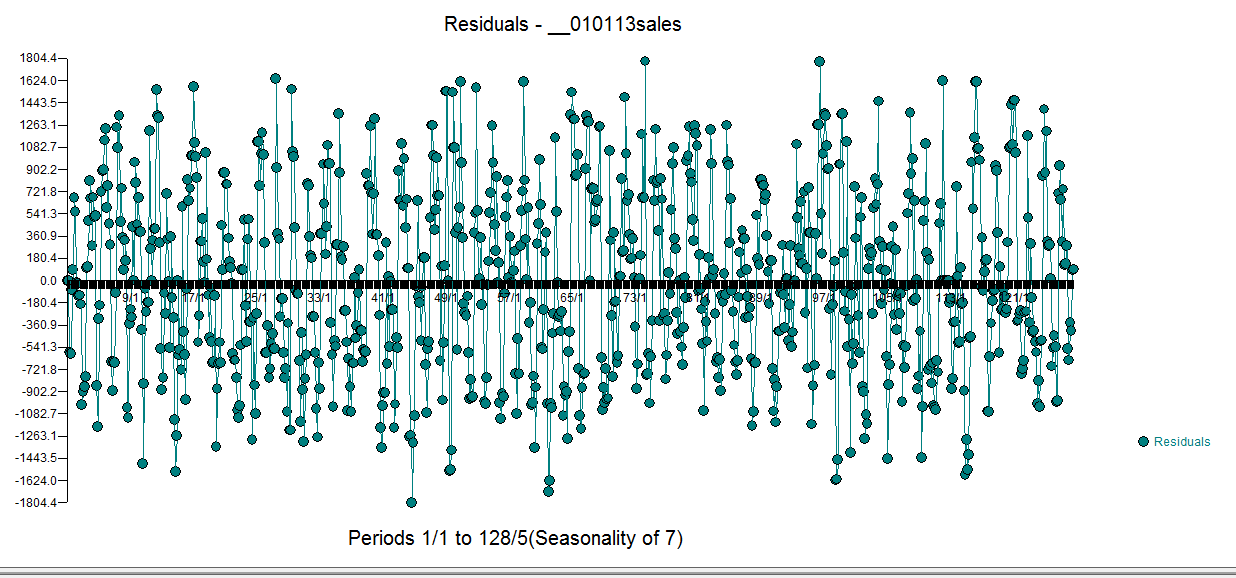
The data has spoken and I have listened ! ... Your data is non-stationary
With respect to the tests you were trying ..You need to know what hypothesis is being tested and what the alternative hypothesis is for each test. You need to know the exact assumptions under which these(any) tests are valid.
Differencing your data is totally unnecessary and is the "rong fix" for your data . See Seasonality after 1st differencing

