I am helping to review a manuscript and suffering from mental block on some data analysis. The data in question is from a cross-sectional survey, a health care provider KAP (knowledge, attitudes, and practices) on vector borne diseases (Zika, Chikungunya, Dengue, and West Nile Virus).
The question I am stuck on is formatted like so:
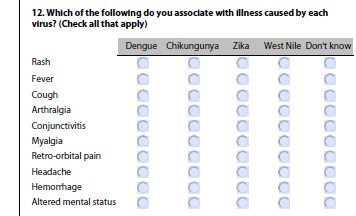
An image of the survey question that I am referencing, for clarity.

Which of the following do you associate with illness caused by each virus? Check all that apply.
                     Dengue   Chikun    Zika    WNV    Don't know
Rash
Fever
Cough
Arthralgia
Conjunctivitis
Myalgia
Retro-orbital pain
Headache
Hemorrhage
Altered mental status
For each disease and symptom, the author has coded a 1 for correct response, and 0 for incorrect response. Not all symptoms present with each disease, and thus leaving the check box empty is considered the correct response in these cases. The primary author is then computing a total correct for each participant (out of 10 possible correctly identified symptoms for each disease). Using the total correct scores, the author is running within-subjects ANOVA on mean correct scores for each disease group in order to identify any differences in levels of knowledge among the different diseases, and then running post-hoc paired t-tests.
In terms of hypothesis, it would be structured like this:
Ho: There are no significant differences in the average number of correctly identified symptoms/illnesses between selected vector borne diseases.
Ha: There is a significant difference in the average number of correctly identified symptoms/illnesses between selected vector borne diseases.
Post-hoc: If there are sig. difference, which diseases have significantly different scores?
I am hoping for your advice on how to best analyze this data as I am quite stumped. My initial thoughts were to code each response (0 - incorrect, 1 - correct) and create contingency tables for each symptom, and analyze with chi-square tests. Although I'm not sure how I would then locate potential differences between each disease.
I should note that the goal is to determine if any differences exist between diseases, not symptoms. Whether it is cumulative or individual to each symptom is not specified.
Is the author correct in running a within-subjects ANOVA, and simply needs to adjust to the proper post hoc test (Tukey?) to identify the differences in diseases?
I should also note that the author is using SPSS for analysis.
Unfortunately, I don't have access to the data at this time to run anything on my end. Any input and feedback is greatly appreciated!
