-1
$\begingroup$

A stick of length $1$ is broken into two pieces of length $Y$ and $1−Y$ respectively, where $Y$ is uniformly distributed on $[0,1]$. Let $R$ be the ratio of the length of the shorter to the length of the longer piece.

Find the PDF $f_R(r)$ of $R$. Hint: What is the PDF of the length of the smaller piece? For $0<r<1$, For $f_R(r)$

I have $f_R(r)= {2\over(r+1)^2}$ or is the answer $f_R(r)= {1\over(r+1)^2}$

Also, $E[R]= ln(4)$ or is the answer, $E[R]= ln(2)−0.5$

$\endgroup$
3
  • 3
    $\begingroup$ Please read the help center in relation to homework-style questions; we treat them somewhat differently. Please show your work, explaining where your pairs of answers come from. I think both your E(R) values are incorrect. $\endgroup$
    – Glen_b
    Commented Aug 6, 2019 at 8:30
  • $\begingroup$ See similar question: stats.stackexchange.com/q/33656/119261. $\endgroup$ Commented Aug 6, 2019 at 9:21
  • $\begingroup$ I have solved the question, I just want someone to confirm me the answer for the same! $\endgroup$
    – Mathew
    Commented Aug 6, 2019 at 10:48

1 Answer 1

1
$\begingroup$

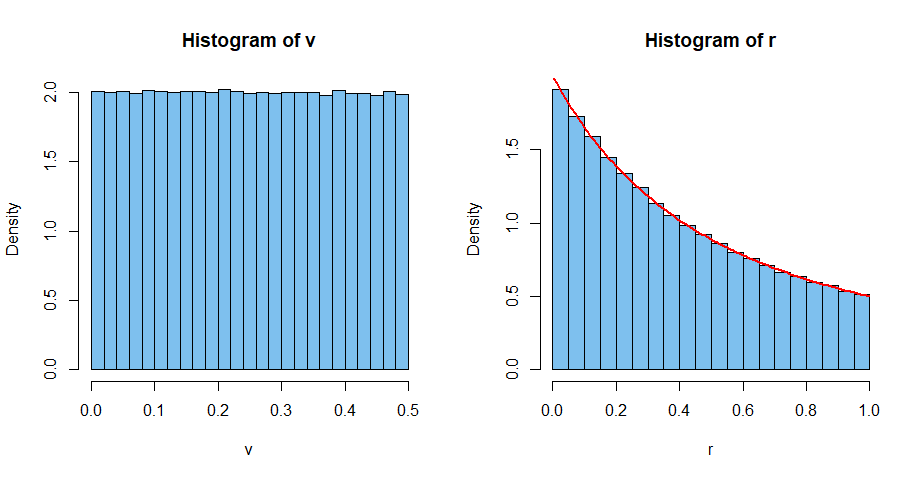
Hints: Here's what I got by simulating the distribution in R. Your first density function seems to work, but neither of your expectations seem to be right. [Especially not $\ln(4) > 1;$ a typo maybe?] With a million iterations, one should expect about two place accuracy.

y = runif(10^6)
v = pmin(y, 1-y);  r = v/pmax(y, 1-y)
mean(r);  sd(r)
[1] 0.3856303
[1] 0.2794012
2*sd(r)/sqrt(10^6)
[1] 0.0005588025    # aprx 95% margin of simulation error

par(mfrow=c(1,2))
 hist(v, prob=T, col="skyblue2")
 hist(r, prob=T, col="skyblue2")
  curve(2/(x+1)^2, add=T, lwd=2, col="red")
par(mfrow=c(1,1))

enter image description here

$\endgroup$
2
  • $\begingroup$ I am not familiar with the use of simulations and graphs. Maybe you could help me with my solution? $\endgroup$
    – Mathew
    Commented Aug 6, 2019 at 10:22
  • $\begingroup$ By simulation, I have shown (to my satisfaction anyhow) that your first proposed density function is correct, but that you have not found the population mean corresponding to that distribution. // If you need help with the derivation, please show your work and maybe someone here can find your mistake evaluating $E(R).$ // If you want someone to do the work for you, this is not exactly the right site, $\endgroup$
    – BruceET
    Commented Aug 6, 2019 at 17:29

Not the answer you're looking for? Browse other questions tagged or ask your own question.