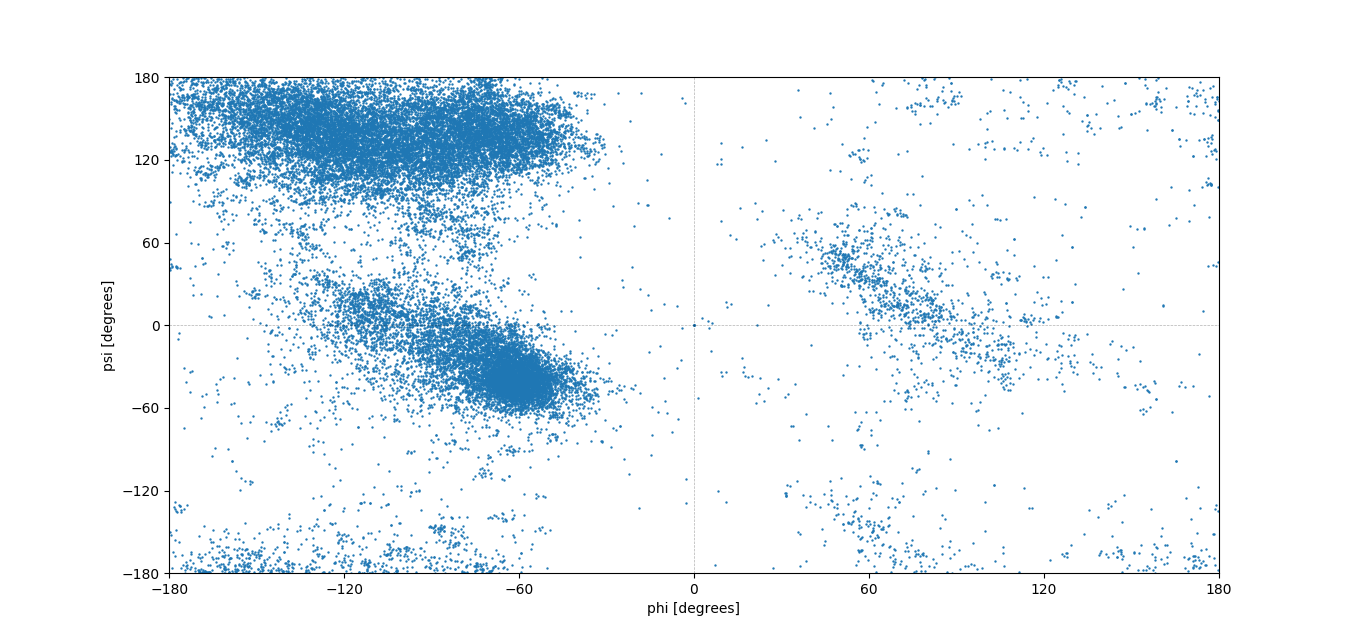
My data coordinates are degrees so each axis has values [-180, 180]. Therefore it's easy to spot that in fact the scatter plot on the right end continues on the left side and the same thing for up and down. It can be assumed that the points are on the torus. 
I need to use k-means algorithm and I wonder how can I modify it (different distance metrics maybe?) so it can work with my torus (so the points from x=-180 will be treated as they are next to the ones from x=180). Is there any nice solution for that or it's not that easy?
