2
$\begingroup$

I am having trouble to intuitively understand why the expected value of the unbiased sample variance is not equal to the square of the expected value of the unbiased sample standard deviation.

In other words, it's been shown that for $$s^2 = \frac{1}{N-1}\sum_{k=1}^N \left(x_i -\overline{x} \right)$$ where $\overline{x}=\frac{1}{N}\sum_{i=1}^Nx_i$ is the sample mean, we have : $$E\left[s^2 \right] = \sigma^2$$ and $$E\left[ s \right] = \sigma \sqrt{\frac{2}{N-1}} \frac{\Gamma(N/2)}{\Gamma((N-1)/2)}$$

Now, how come, if I expect to measure a variance, for eg $v=2$, I can't expect to measure a standard deviation of $s = \sqrt{v} = \sqrt{2}$ ? Again, I'm looking for an intuitive explanation (the math-side has been done already).

$\endgroup$
2
  • $\begingroup$ Maybe just try a simple experiment with sample means. The mean of the integers from 1 through 99 is 50, But it I square each of the numbers 1 through 99 the higher numbers get really huge (with big spaces between) and the sample mean is very much larger. Moreover, simply taking the square root of the latter mean doesn't bring the result all the way back to 50. Computations in R: x = 1:99; mean(x); mean(x^2); sqrt(mean(x^2)) returns 50, 3316.667, and 57.59051. // BTW, your last equation is only for normal data. $\endgroup$
    – BruceET
    Commented Sep 27, 2019 at 2:42
  • $\begingroup$ By contrast, if I use a linear transformation, multiplying each value by 100 (the values get larger, but remain equally spaced), and I can "un-do" the transformation by dividing by 100: x = 1:99; mean(x); mean(100*x); mean(100*x)/100 returns 50, 5000, and 50, respectively. $\endgroup$
    – BruceET
    Commented Sep 27, 2019 at 2:55

1 Answer 1

3
$\begingroup$

Graphs for Comments.

Stripchart of values of $x^2$ for $x = 1, 2, \dots, 99,$ with sample mean.

enter image description here

Stripchart for values of $100x.$

enter image description here

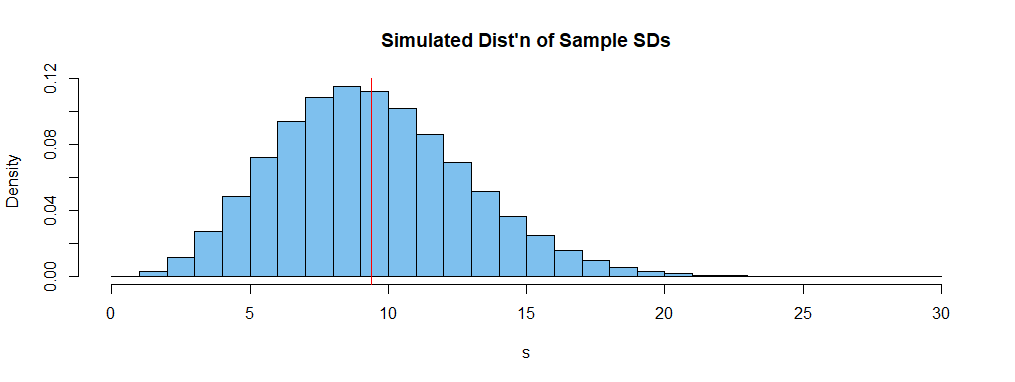
Simulation illustrating your formula for $E(S)$ where $S$ is the SD of a sample of size $n = 5$ from a normal population with standard deviation $\sigma = 10.$ Based on a million normal samples of size five. [I chose $n = 5$ for illustration because the discrepancy between $E(S)$ and $\sigma$ is especially large for small $n.]$

set.seed(626)
s = replicate(10^6, sd(rnorm(5, 100, 10)))
mean(s)
[1] 9.403078                      # aprx E(S) from simulation
10*sqrt(2/4)*gamma(5/2)/gamma(4/2)
[1] 9.399856                      # exact from formula

enter image description here

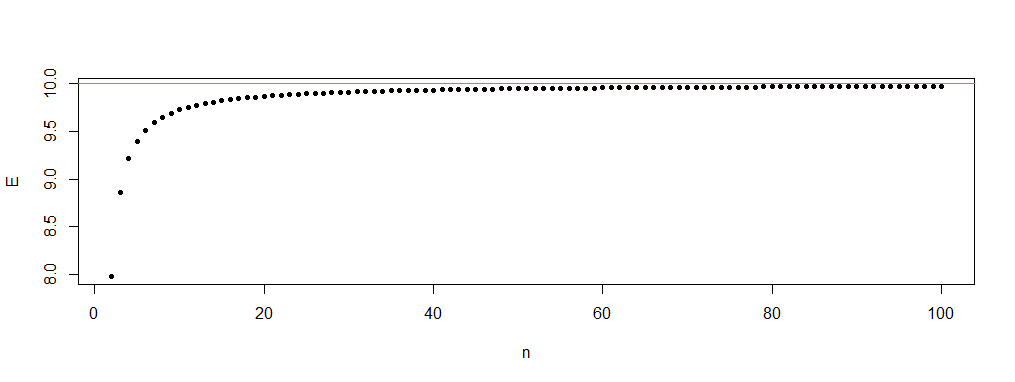
Illustrating the convergence of $E(S_n)$ to $\sigma = 10$ for normal data.

n = 2:100
E = 10*sqrt(2/(n-1))*gamma(n/2)/gamma((n-1)/2)
plot(n, E, pch=20)
 abline(h=10, col="green2")

enter image description here

To understand why, for $n=2,$ $E(S_2)$ is so small, it may help to show that $S_2$ is the sample range divided by $\sqrt{2}:$

$$S_2^2 = (X_1 - \bar X)^2 + (X_2 - \bar X)^2 \\ = \left(\frac{2X_1-X_1-X_2}{2}\right)^2+\left(\frac{2X_2-X_1-X_2}{2}\right)^2\\ = \frac {1}{4} (X_1 - X_2)^2 + \frac {1}{4} (X_2 - X_1)^2 =\frac 12(X_1 - X_2)^2.$$

Thus $S_2 = |X_1-X_2|/\sqrt{2}.$

$\endgroup$

Your Answer

By clicking “Post Your Answer”, you agree to our terms of service and acknowledge you have read our privacy policy.

Not the answer you're looking for? Browse other questions tagged or ask your own question.