3
$\begingroup$

I have a data set of half hourly CO2 and CH4 fluxes (emission/uptake) from a landscape along with a set of environmental variables (Photon flux density (PPFD), temperature etc.).

I'm using Neural Network (NN) to model CO2 fluxes given the environmental variables. I used bootstrapping to estimate the variance of the NN estimates which I've use to calculate confidence intervals. For example this figure shows the observed and modeled response of CO2 fluxes to just PPFD. enter image description here
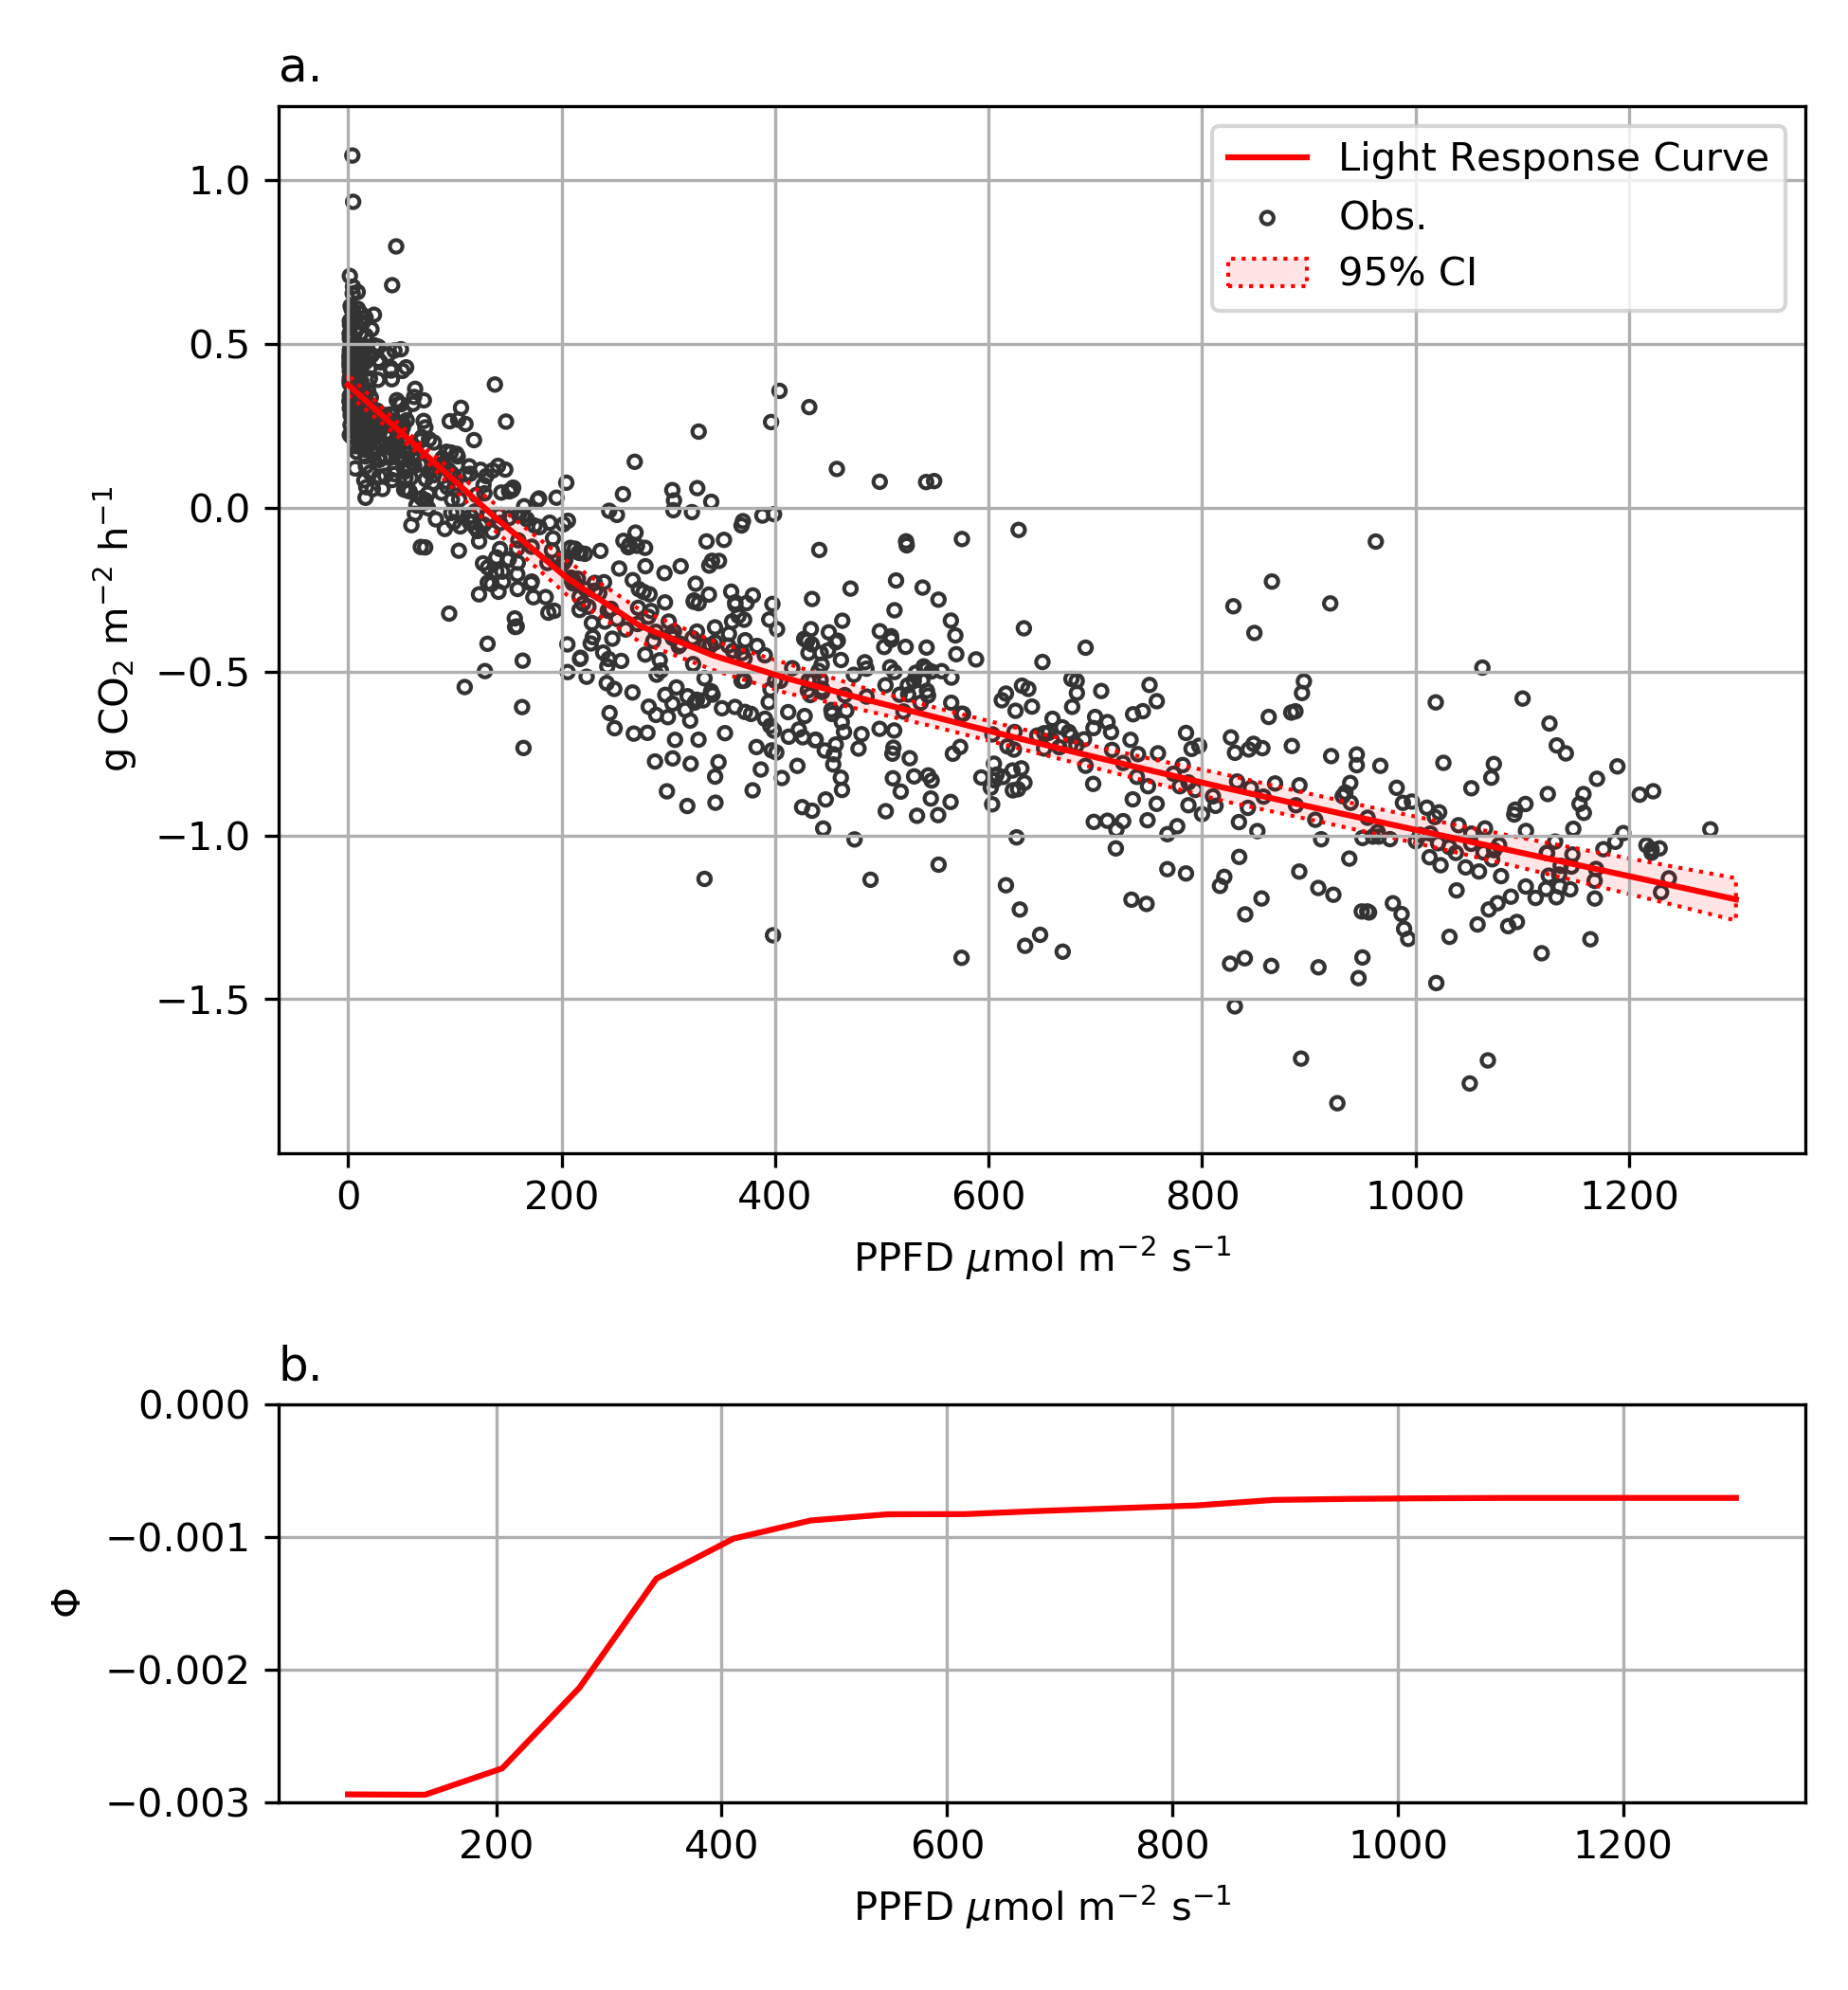
The observed data set has gaps and I'm using the NN estimates to gap-fill (impute) the time series. The question I have is how should I calculate the confidence interval for the mean CO2 fluxes. I want to calculate the mean my study period (48 half hourly obs.) but 4 values are missing, so I fill them NN estimates. How should I calculate the confidence interval for this mean?

If I use like the standard formula $\bar{u} \pm \frac{s}{\sqrt{n}} t(1-\alpha,n)$, I get a mean CO2 flux of $-0.301 \pm 0.027 g m^{-2} h^{-1}$ but I feel like his misrepresents the uncertainty? 28% of the observations were gap-filled with NN estimates which had a RMSE = 0.29? As mentioned, I have uncertainty estimates for each NN estimated value used to gap-fill my time series, but I'm just not sure how to include that uncertainty into my confidence interval for a mean?

$\endgroup$

1 Answer 1

1
+50
$\begingroup$

Multiple imputation would provide a principled way for you to proceed.

You make a collection of datasets each of which has the same known values but has separately imputed values for the missing data points. You analyze each of those datasets separately, then consolidate the analyses into a single result to provide means and confidence intervals of interest. Multiple imputation thus takes into account both the inherent variability and the additional variability added by the imputation.

As you are already doing NN modeling for imputation and you are repeating NN on multiple bootstrap samples, if you separately impute the missing data for each bootstrapped data sample you might accomplish this all together. If that doesn't work in your case (for example, I'm not sure how you are bootstrapping these time series) you could alternatively consider the multiple-imputation and analysis-pooling facilities provided by the R mice package.

$\endgroup$
1
  • $\begingroup$ Thanks, I thought it had something to do with that, but everything I saw on Multiple Imputation seemed pretty abstract & i wasn't really sure how to implement it. $\endgroup$ Commented Oct 10, 2019 at 22:43

Your Answer

By clicking “Post Your Answer”, you agree to our terms of service and acknowledge you have read our privacy policy.

Not the answer you're looking for? Browse other questions tagged or ask your own question.