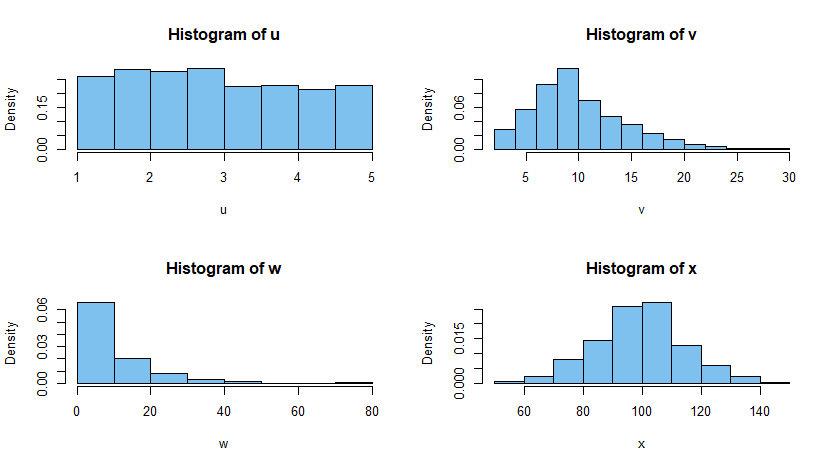
There is a set of different data set, each of which corresponds to a histogram. Are there any metrics that can be used to characterize the shape of each histogram, and further compare different histogram.
-
1$\begingroup$ It is difficult to say which descriptive statistics are best for your work without seeing the histograms and knowing your objectives. The sample mean, median, upper and lower quartiles, and standard deviation are a few commonly used ones. Many statistical software programs have a a single procedure that gives several descriptive statistics. $\endgroup$– BruceETCommented Oct 20, 2019 at 18:30
-
$\begingroup$ No time to reply, but the answers to this question might help: stats.stackexchange.com/questions/112267/… $\endgroup$– user20637Commented Oct 20, 2019 at 20:17
1 Answer
Graphical comment: Here is a session in R, which takes random samples of size 500 from uniform, gamma, exponential, and normal distributions. Descriptive statistics are shown for each sample, with very brief comments about the sample statistics. Histograms of all four samples at the end. (Although $n = 500$ is a relatively large sample size, not even a sample of this size will capture all of the information about the population from which the sample was drawn.)
set.seed(2019)
u = runif(500, 1, 5)
summary(u); sd(u)
   Min. 1st Qu.  Median    Mean 3rd Qu.    Max.
  1.015   1.900   2.784   2.897   3.850   4.983
[1] 1.141427  # SD
A symmetrical population. Sample mean and median nearly equal. Max and min relatively close to mean.
v = rgamma(500, 5, .5)
summary(v); sd(v)
   Min. 1st Qu.  Median    Mean 3rd Qu.    Max.
  2.279   7.087   9.232  10.075  12.552  28.166
[1] 4.472566
Right-skewed. Sample mean larger than median. Relatively large maximum.
w = rexp(500, .1)
summary(w); sd(w)
    Min.  1st Qu.   Median     Mean  3rd Qu.     Max.
 0.00579  3.25538  7.08604 10.08962 13.39552 71.72390
[1] 10.1692
A right-skewed with a very heavy right tail: Mean larger than median. Max is much farther from mean (about 60) than is minimum (about 10).
x = rnorm(500, 100, 15)
summary(x); sd(x)
   Min. 1st Qu.  Median    Mean 3rd Qu.    Max.
  56.03   89.69   99.73   99.29  108.22  146.50
[1] 15.22132
Symmetrical. Sample mean and median nearly equal. Max and min both about the same distance from the mean.
Sometimes boxplots are used to explore shapes of distributions. In case you know about boxplots, here are boxplots for the four samples.
Maybe this much will help to answer your question. If not, maybe this will help you formulate a more precise question. (If you have questions about these four samples, please leave a comment and maybe one of us can answer.)


