3
$\begingroup$

I’m searching for a changepoint algorithm to identify

  • a single changepoint
  • in normally distributed data
  • with missing values
  • and I have strong prior knowledge about where changepoint happens.

I tested several R packages (e.g. “changepoint”, “bcp”) but they all seem to fail when (even a few) values are missing in the dataset. Can anyone suggest an appropriate algorithm or even a software implementation in R or Python?

Background: I conducted a study where 200 participants worked on a specific task for 100 consecutive days. Some participants responses are invalid (at guessing probability) at the first few measurement timepoints because they didn’t understand the task correctly. After repeating the instructions, the got it and their task performance suddenly increased. I want to identify these subjects without doing that manually.

$\endgroup$

2 Answers 2

4
$\begingroup$

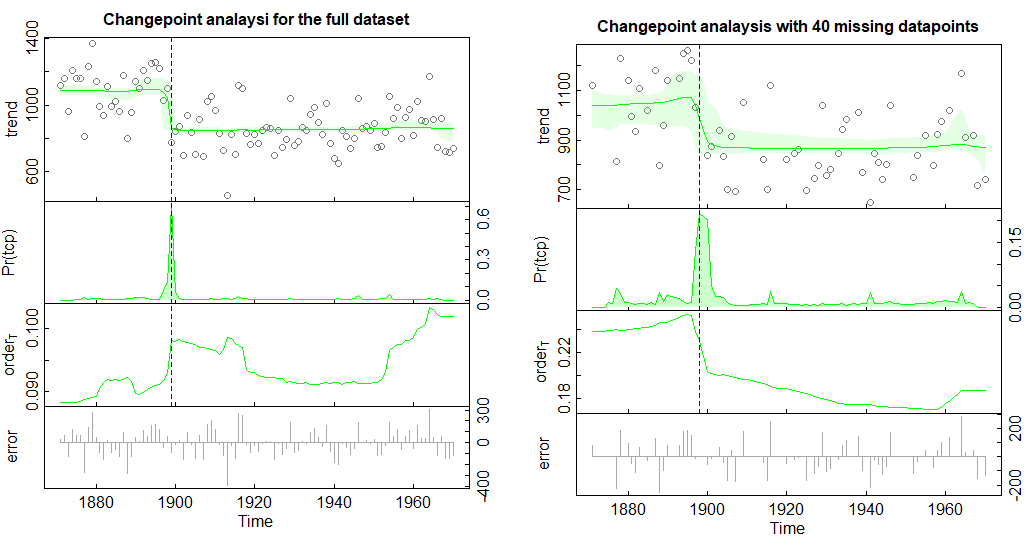
If you are working on time series data or 1D univariate sequence data, a possible package available in R, Python, and Matlab is Rbeast (https://github.com/zhaokg/Rbeast). It is a Bayesian changepoint detection algorithm that can handle missing data; it can also decompose time series into periodic and trend components, if needed. Below are some quick examples using the Nile river flow and COVID-19 daily new cases data:

library(Rbeast)

####         The full time series                  ####
plot( beast(Nile) , main='Changepoint analysis for the full dataset')

####Introduce NAs at 40 random locations out of 100####
set.seed(1234)
NileNA = Nile
NileNA[ sample(length(NileNA),40)  ]= NA

plot(beast(NileNA), main='Changepoint analaysis with 40 missing datapoints')
enter image description here

beast estimates the probability of changepoint occurrence over time, which is the green Pr(tcp) curve above. The peak corresponds to the region/point where the changepoints are most likely to occur.

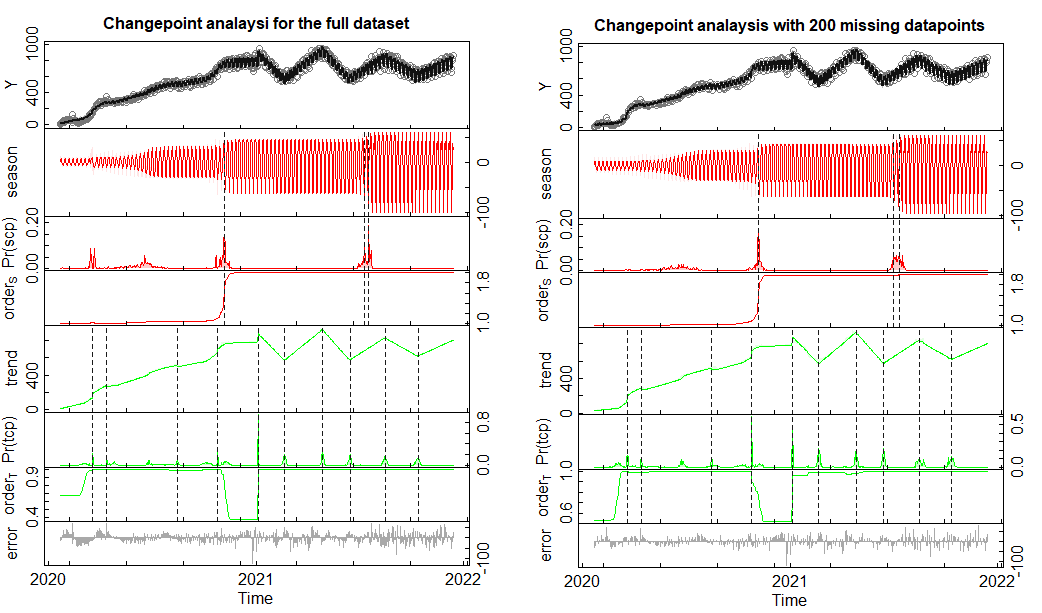
###covid19 is a daily time series with a weekly cyclic component (i.e., freq=7)
startdate  = as.numeric(covid19$date[1]) 
out        = beast(sqrt(covid19$newcases), start= startdate, deltat=1, freq=7)
out$time   = as.Date(out$time, origin='1970-01-01') # Convert from integers to Date.

plot( out, main='Changepoint analaysi for the full dataset')

###Introduce NAs at 200 random locations out of 694
set.seed(1234)
newcasesNA = covid19$newcases
newcasesNA[ sample(length(newcasesNA), 200)  ]= NA
out1          = beast(sqrt(newcasesNA), start= startdate, deltat=1, freq=7)
out1$time     = as.Date(out1$time, origin='1970-01-01') # Convert from integers to Date.

plot( out1, main='Changepoint analaysis with 200 missing datapoints')
enter image description here

In the figure above, the time series was decomposed into two components: a periodic curve together with periodic structural changes (i.e., Pr(scp), and a trend curve together with trend changepoints (i.e., Pr(tcp)).

$\endgroup$
1
$\begingroup$

If you are just fitting a change in mean and/or variance in Normal observations then you should just be able to remove the missing observations (i.e. data length 100 with 5 missing observations becomes data length 95) and apply the changepoint techniques, either changepoint or BCP. If this doesn't work then it may be that your change is too small relative to the length and variance of the segments. Adding an example plot to your question may help assess this.

The reason you can do this is that there is no dependence in the data and the existence of a changepoint just equates to saying there is a change between two time points, not when in-between.

In general you need to be careful about inference of the changepoint locations if they coincide with missing data points but your application seems to indicate that this wouldn't be a problem.

$\endgroup$

Your Answer

By clicking “Post Your Answer”, you agree to our terms of service and acknowledge you have read our privacy policy.

Not the answer you're looking for? Browse other questions tagged or ask your own question.