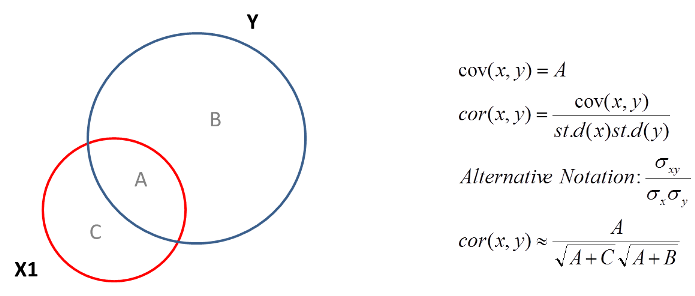
I recently learned about the use of Ballentine [sic] diagrams to illustrate some principles of linear regression. There appear to be a few different implementations of this principle. Notably, in some such diagrams area is proportional to squared correlation (rather than variance), and each circle consequently has area 1. I have questions about another implementation, described here, in which area is proportional to variance.
First consider the following:
 The above makes sense to me, and I agree with the calculation for correlation.
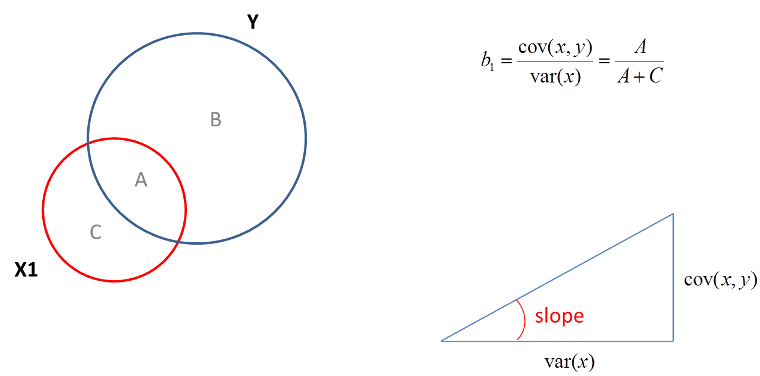
Now consider:
 The above also makes sense to me, and I agree with the calculation for slope.
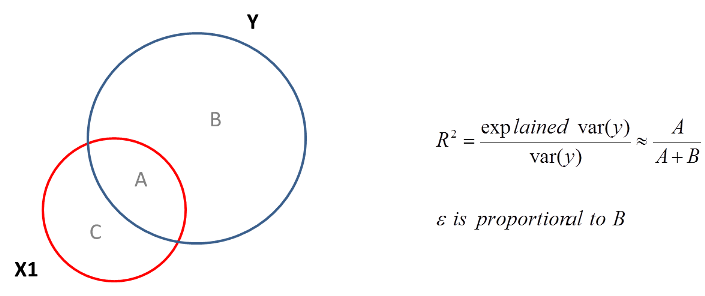
Finally, consider:
 This is where I get lost. The calculation for $R^2$ is almost intuitively reasonable, but it seems off by a factor of $A/(A+C)$. I would think $R^2=\mathrm{cor}(x,y)^2$.
- Is the published formula for the coefficient of determination correct, or is explained variation of $Y$ really equal to $\frac{\mathrm{Cov}(x,y)^2}{\mathrm{Var}(x)}$ instead of $\mathrm{Cov}(x,y)$?
- More generally, how should I think about this visualization given that it's possible that $\mathrm{Cov}(x,y)>\mathrm{Var}(x)$ (i.e. $A>(A+C)$)? I know A, B, and C use different units; is that part of the key to understanding it?
