2
$\begingroup$

Let us generate a sample from a random variable. Without any particular reason other than to illustrate my question, let us generate a sample of size 1'000'000 from a variable that follows a normal distribution with mean 30 and variance 10 —that is, $X$~$N(30, 10)$—. The way we'll be doing that is in R.

Here's the code:

set.seed(20)

x = rnorm(1000000, 30, 10)

Lets say that we want to know what's the probability of $X\leq20$. Naturally, we can compute that probability by calculating the area below the density function in the interval $]-\infty$, 20]. Again, the following chunk displays how we can do that in R. Needless to say, for this to work package pracma should have been previously installed.

arg = (20 - 30)/(sqrt(10)*sqrt(2))

library(pracma)

prob = (erf(arg) + 1)/2

So now variable prob stores the value of $P(X\leq20)$. It turns out the value is $0.0007827011$.

Now is when my question actually starts. Since we have a —rather big— sample from that random variable, I suppose that a good estimation of $P(X\leq20)$ should be obtained by counting how many observations of the sample have a value lower than or equal to 20, and then dividing that amount by the size of the sample. Let us do just that.

sum(x <= 20)/length(x)

The value that this line of code yields is $0.159008$.

Therefore, even though our sample is —I think— quite big, the relative frequency of the observations that are lower than or equal to a given value t is not a good estimator of $P(X\leq t)$.

My question is why.

$\endgroup$
3
  • $\begingroup$ This may be an outlying observation or some problem with R syntax. I checked it in python and it works. $\endgroup$
    – Roger V.
    Commented Dec 19, 2019 at 9:07
  • 1
    $\begingroup$ R uses standard deviation, not variance, in the *norm family of functions. If you want samples from a normal distribution with mean 30 and variance 10, you should call rnorm(1000000, 30, sqrt(10)). $\endgroup$ Commented Dec 19, 2019 at 9:21
  • 1
    $\begingroup$ There are some naming choices in some packages that can easily mislead a distracted reader. See rdocumentation.org/packages/compositions/versions/1.40-3/topics/…, for example... $\endgroup$ Commented Dec 19, 2019 at 9:27

1 Answer 1

2
$\begingroup$

Sample proportions are a pretty good way to estimate population proportions -- which is to say "simulation works fine". With very tiny probabilities like these you can "do better" (in terms of getting more accurate estimates for less work), but I will just focus on standard simple simulation here.

The main issue in your calculation is not a problem with using a sample proportion from simulation to estimate a true (population) probability, but one of implementation. That is, your basic idea was fine but your code isn't doing what you wanted it to. The normal random number generation (rnorm) uses standard deviation not variance; this is pretty typical of functions in many other packages.

Big hint #1: always check the help on functions if you don't know them really well (and sometimes, even then).

Big hint #2: if you get weird results, always assume your code is wrong, not that simulation doesn't work. This is the correct assumption maybe 99.9% of the time -- even if you used big hint #1 -- and finding coding errors/fixing your code is where you should spend your effort when trying to solve the mystery of what's gone wrong. If you're really, really sure everything is exactly right in your code, only then worry about what else might be wrong.

[It also seems very odd to load pracma simply in order to use erf to calculate something that's more easily calculated by a built in function call to pnorm]

Here's your simulation done in R, without errors:

set.seed(20)
x = rnorm(1000000, 30, sqrt(10) )
mean(x<20)
# compare theoretical value:
pnorm(20,30,sqrt(10))

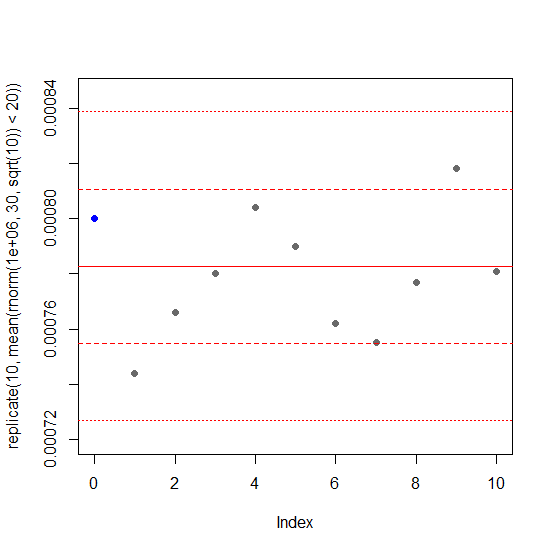
(you should get $8\times 10^{-4}$ and $7.83 \times 10^{-4}$. Note that the standard error of the sample proportion here is $2.8\times 10^{-5}$ so these two values are only about as far apart as you'd reasonably expect to see)

# now let's do a bunch more simulations
m=pnorm(20,30,sqrt(10))
s=sqrt(m*(1-m))/1000
ns=10

plot(replicate(ns,mean(rnorm(1000000,30,sqrt(10))<20)),
  xlim=c(0,ns),ylim=c(-2.25,2.25)*s+m,pch=16,col="dimgrey")
points(0,mean(x<20),pch=16,col=4)
abline(h=c(m+(-2:2)*s),col=2,lty=c(3,2,1,2,3))

plot of original estimate and ten additional simulations

You should see that the simulation estimates are all in the ballpark of the right answer. I get 2/11 more than one standard error from the mean, and none outside two standard errors from the mean which is all well within the realms of the sort of variation you could expect to see if everything is as it should be.

Doing 100 extra simulations instead of 10 (just change ns) only takes a few seconds, but if you do a lot of simulations you might want to make the vertical spread of the plot wider so you don't lose points.

$\endgroup$

Your Answer

By clicking “Post Your Answer”, you agree to our terms of service and acknowledge you have read our privacy policy.

Not the answer you're looking for? Browse other questions tagged or ask your own question.