In a recent competition the participants where invited to predict the type of hemorrhage in 121,232 CTR images.
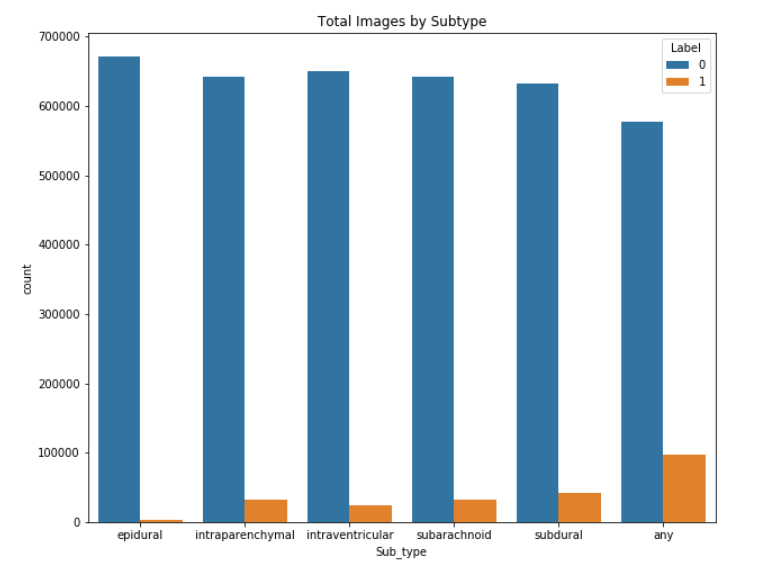
More specifically, the participants were called to submit predicted probabilities for each CTR image using 6 possible labels (5 labels corresponding to 5 different types of haematomas and a 6th label indicating whether an haematoma existed in the CTR image). The prevalence of haematomas in the CTR images was possibly analogous to the one observed in the training data which was the one below:
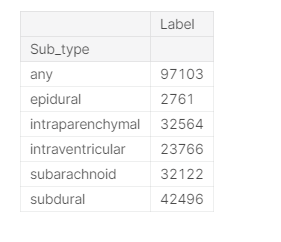
(E.g. approximately 570,000 images in the training data had no haematoma and approximately 100,000 had some type of haematoma and more specifically the ones having haematomas had the following distribution:
)
Here is the text from the competition:
Submissions are evaluated using a weighted multi-label logarithmic loss. Each hemorrhage sub-type is its own row for every image, and you are expected to predict a probability for that sub-type of hemorrhage. There is also an any label, which indicates that a hemorrhage of ANY kind exists in the image.
For each image Id, you must submit a set of predicted probabilities (a separate row for each sub-type). We then take the log loss for each predicted probability versus its true label. Finally, loss is averaged across all samples.
So the submission table would contain 121,232 x 6 = 727,392 rows with a probability attached to each row.
My questions are :
1) Can you calculate analytically the probability of achieving a score in the range [0.055 , 0.045] by assigning probabilities using no other information than the one supplied here? (E.g. randomly or based on the observed distribution of labels in the training set).
2) Can you describe a computer simulation that would provide an estimate of this probability?


