2
$\begingroup$

I have time-series data consisting of the sum of 2 sinewaves and my goal is to predict their frequencies and their amplitudes.

I would like to know what are the best distance metrics/loss functions I can use.

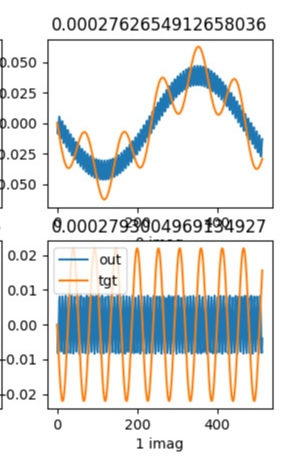
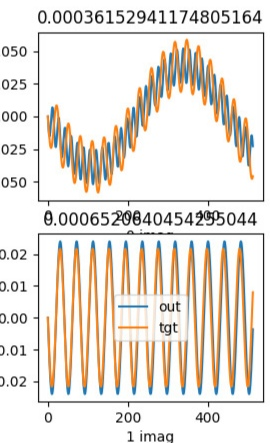
You can see from the following plots that the mean-square-error (MSE) is not an appropriate metric. In blue the predicted reconstructed sinewave, in orange the target one. As the title of the subplots, you can find the value of the MSE. In the first figure, the reconstruction is kindly worse, however, the MSE tells a different story.

First:

enter image description here

Second:

enter image description here

Is there a metric that can better emphasize this?

$\endgroup$

1 Answer 1

0
$\begingroup$

When talking sine waves, the first thing that comes to my mind would be the observe them in the frequency domain. Each of your curves can be described as:

$$y(t) = a_0 + a_1 \cos(2 \pi f_1 t) + b_1 \sin(2 \pi f_1 t) + a_2 \cos(2 \pi f_2 t) + b_2 \sin(2 \pi f_2 t)$$

with $f_k$ denoting the frequencies of the two harmonics, and $a_k$ and $b_k$ the Fourier coefficients (cosine and sine amplitudes at the corresponding frequency). I'd construct the target and the reconstructed vector, $t$ and $r$:

$$t = \left[ a_{0t}, f_{1t}, a_{1t}, b_{1t}, f_{2t}, a_{2t}, b_{2t} \right]$$ $$r = \left[ a_{0r}, f_{1r}, a_{1r}, b_{1r}, f_{2r}, a_{2r}, b_{2r} \right]$$

with frequencies and the Fourier coefficients as the components. I would then simply calculate the Euclidean distance between the two vectors, perhaps with some scaling of the frequency components, because frequency and amplitude are measured in different units.

$\endgroup$
2
  • $\begingroup$ Thank you very much. It is a pretty neat solution, but I am interested in the case of sine waves in the time domain. $\endgroup$
    – Chutlhu
    Commented Jan 28, 2020 at 20:53
  • $\begingroup$ Maybe you should start from the end: Why do you need to know the distance? Do you intend to make a decision, or should it play a part in a control loop or something else? Also, why do the curves differ? Do you have a generative model and a noise model? Finally, as a hint: In signal processing, the signal-to-noise ratio (en.wikipedia.org/wiki/Signal-to-noise_ratio) is the usual way to measure quality of fit. In your case, the signal would be the "target" would be the signal, and the difference between the "target" and the "reconstructed" curve the noise. $\endgroup$
    – Igor F.
    Commented Jan 29, 2020 at 8:04

Your Answer

By clicking “Post Your Answer”, you agree to our terms of service and acknowledge you have read our privacy policy.

Not the answer you're looking for? Browse other questions tagged or ask your own question.