2
$\begingroup$

I have some data similar to this

died  age  hospital
0     75     AA
0     88     AA
1     81     AA
0     77     AA
1     65     AA
0     41     AA
0     66     BA
1     81     BA
0     82     BA
1     64     BA
0     65     BA
1     52     BA

I was asked to calculate "age adjusted mortality rates" for each hospital. There are around 150 hospitals and approx 1000 patients (observations) per hospital. Each row in the data concerns a particular patient.

I was told how this could be done in Stata:

  • Perform logistic regression of died on age.
  • Use the predict function to get patient-level probabilities of death.
  • Summarise the patient-level probabilities by hospital to get the mortality rates for each hospital.

However, I am using R.

Is this the correct approach ? Are the alternatives ? Can I do the same thing in R with glm and predict ?

Edit:

I should perhaps add that there are several other variables that are going to be adjusted for in the model. I have shown age above, just for simplicity.

$\endgroup$

2 Answers 2

4
$\begingroup$

Seems right. Here are the codes for replication.

died     <- c(0,0,1,0,1,0,0,1,0,1,0,1)
age      <- c(75,88,81,77,65,41,66,81,82,64,65,52)
hospital <- c(rep("AA",6),rep("BA",6))
mydata   <- data.frame(died, age, hospital)
m01 <- glm(died~age, family=binomial)

Now, for prediction:

> predict(m01)
           1            2            3            4            5            6 
-0.398530343 -0.547998721 -0.467515748 -0.421525478 -0.283554668 -0.007613048 
           7            8            9           10           11           12 
-0.295052236 -0.467515748 -0.479013316 -0.272057101 -0.283554668 -0.134086291 

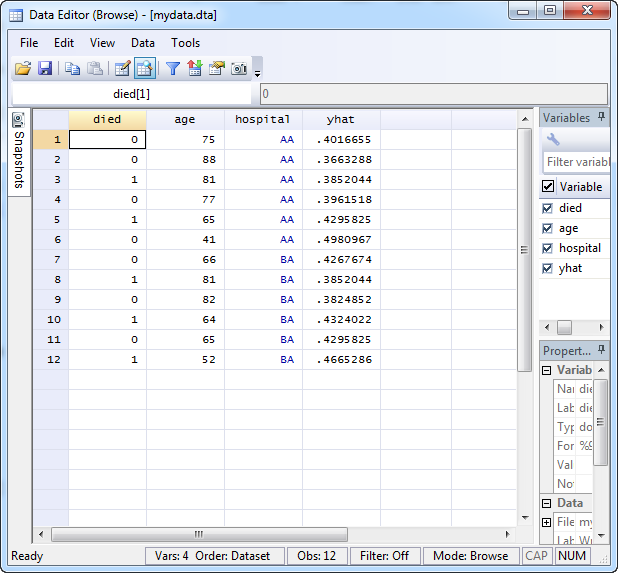
which gives predicted ln(odds). And

> predict(m01, type="response")
        1         2         3         4         5         6         7         8 
0.4016655 0.3663288 0.3852044 0.3961518 0.4295825 0.4980967 0.4267674 0.3852044 
        9        10        11        12 
0.3824851 0.4324021 0.4295825 0.4665286 

gives predicted probability.

Stata says the same thing (see instruction I used and image I got)enter image description here

But the more important comment is that in epidemiology, "age-adjustment" can also mean rates that are standardized by a certain reference population make up. You said "you were asked" and "you were told to do that in Stata." If these are told by the same person then I think you're fine. If they are two different people you should go back and clarify if (s)he meant epidemiological adjustment or statistical adjustment.

Also, analytically... I feel that if hospital care is a main factor, then we shouldn't go into the picture assume that the mortality risk is even across hospitals. I think it may make more sense to do the prediction by hospital, and then apply an imaginary patient body across each of the hospitals, and the come up with their relative death rates. This approach seems more "age-adjusted." Alternatively, your other predictors should better include hospital characteristic or even the hospital variable itself.

$\endgroup$
3
  • $\begingroup$ Thank you (+1) ! This is helpful. Actually this is not age-adjustment in the sense of a reference population - simply an adjustment via a regression model. But thanks again for mentioning this (actually, after I posted the question I realised this might be inferred and that's why I made the "edit" as there are about 7 other variables that I need to add). $\endgroup$
    – LeelaSella
    Commented Nov 30, 2012 at 21:28
  • $\begingroup$ @P Sellaz Oh, I see. And please also read my last paragraph that I just added. I am not sure about your research question but I felt that can be a potential problem. $\endgroup$ Commented Nov 30, 2012 at 21:32
  • $\begingroup$ Thanks again. Hospital care /is/ a main factor. Actually the research project was looking at how hospital-level variation in outcomes has evolved over time. I was asked to produce (a summary of) these mortality rates to be used in the abstract for conference presentation, to give some context to the project. $\endgroup$
    – LeelaSella
    Commented Nov 30, 2012 at 21:46
0
$\begingroup$

Well, I've worked it out for myself, though I'm still a little unsure if it is the correct approach.

fit1 <- glm(died~age,family=binomial(link=logit),data=dt)
pr <- predict(fit1, type="response")
dt <- cbind(dt,pr)

hosp.mortality.rates <- by(dt$pr, dt$hospital, mean)
$\endgroup$

Your Answer

By clicking “Post Your Answer”, you agree to our terms of service and acknowledge you have read our privacy policy.

Not the answer you're looking for? Browse other questions tagged or ask your own question.