1
$\begingroup$

I am new to R. I am trying to do a logistic regression using a categorical and continuous variable and I am supposed to select the right variable for my model. There are 27 variables and a 8,000 observations.

I have gone through a couple of articles online including stepwise regression by AIC and all I do is confuse myself the more. I was also told to select my variables from the correlation matrix but when I do the correlation I don't seem to find the correlation especially with the categorical variable. I also try to fit all the model and I get some variables with p-value less than 0.5. This is the code:

d4 <- d3[,c('SW','MOI','YOI','DOI_CMC','RMOB','RYOB','RDOB_CMC', 'RCA','Region','TPR','DPR','NV','HEL','Has_Radio','Has_TV', 'Religion','WI','MOFB','YOB','DOB_CMC','DOFB_CMC','AOR','MTFBI', 'DSOUOM_CMC','RW','RH','RBMI')] cor(d4) d5 <- cor(d4) round(cor(d4),2) When I select the significant variables and try to apply logistic regression all the p value will be between 0.9 to 1. See code:

d3 <- lm(TPR ~ SW + MOI + RMOB + RYOB + RCA + Region + TPR + DPR + NV + HEL + Has_Radio + Has_TV + Religion + WI + MOFB + YOB + DOB_CMC + DOFB_CMC + AOR + MTFBI + DSOUOM_CMC + RW + RH + RBMI, data = d3, family = "binomial") summary(d3) I need help with this please!! Here is the sample of d3 d3 Sample

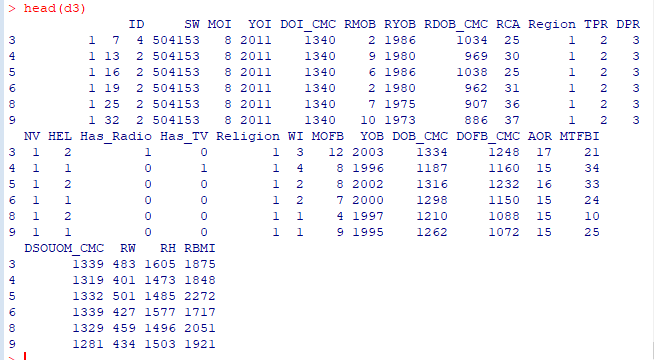
d3 data

$\endgroup$

1 Answer 1

1
$\begingroup$

I agree, correlation will just throw you in another direction that's not warranted -- and besides, it's not what you're after.

What you need to do (formally) for logistic regression is use Model Building Strategies (MBS). MBS is based on first running "univariate" logistic regression with each independent predictor variable singly. Thus just copy the R-code to create 27 logistic models, each of which uses one variable (with the same dependent variable with values of 0 and 1). Next, look at the p-value for each univariate model, and write down which ones have a p-value$\leq 0.25$ (each univariate model has two predictors, a "constant term" and the predictor, so don't pay attention to the p-value for the constant term in each univariate model -- only the predictor variable).

Then include all the single predictors whose univariate p-values were $\leq 0.25$ into a multivariate model (multiple variables) and run this model one time. This is your final model after running MBS. You can remove any variables from the multivariate model, and re-run the final model using only significant predictor variables, since removal of the non-significant predictors probably won't change the results.

One thing that is certain in "modeling," or evaluating different regression models, is that the results of any model depends on the correlations between all the predictor variables, and these essentially may be linear and non-linear. You commonly just don't know the results of any model before hand, until you run it, because the contribution to the model by different predictors can change with different combinations of predictors.

The free edition of Explorer will run MBS for logistic regression your 27 variables. (see Example 3 of Chapter 7 in the User Guide).

$\endgroup$
1
  • $\begingroup$ Thanks for taking the time to provide this detailed explanation!! $\endgroup$
    – Jay
    Commented Mar 10, 2020 at 3:39

Your Answer

By clicking “Post Your Answer”, you agree to our terms of service and acknowledge you have read our privacy policy.

Not the answer you're looking for? Browse other questions tagged or ask your own question.