1
$\begingroup$

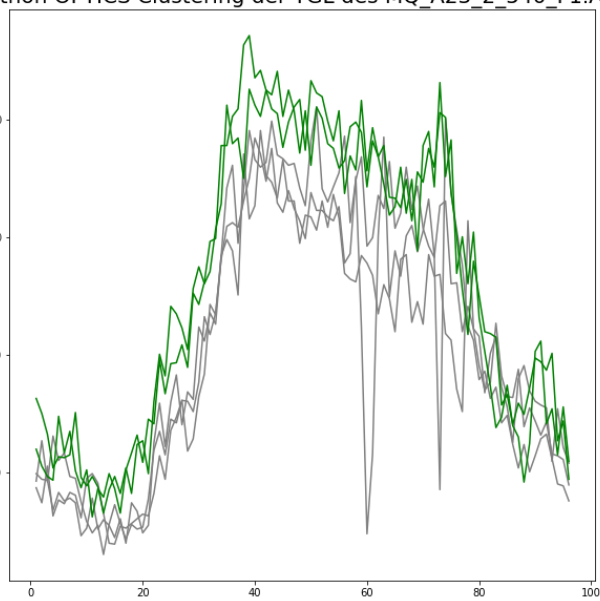
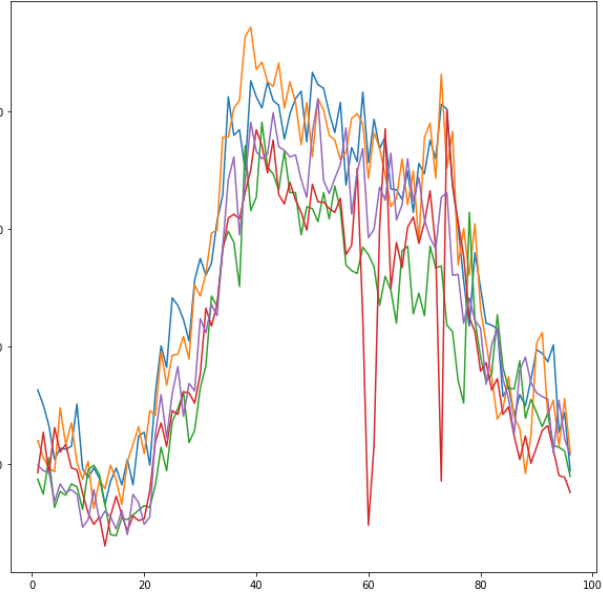
I would like to cluster uni-variate daily time series so that an emphasis is put on sudden drops in time series. Series that contain such uncommon drops should be in one cluster (drops should influence the distance to other series), whereas series that don't have such nosedives are in another cluster. Each series consists of 96 values (a 15-minutes aggregation interval).

Below you can see five exemplary series before clustering:

before clustering

And here, after - series have been clustered with k-means with euclidean distance as a similarity measure:

after clustering

In this specific case I would like to obtain a clustering that yields the 1:4 grouping, in which the red series (see picture 1) is in one cluster (its distance to "normal" series is big) and four other series are in the second cluster.

What is a suitable distance metric to be used in order to achieve the desired result? Should series be represented in other way, for example as a feature vector? If so, what is a statistical property that accounts for such abrupt changes?

$\endgroup$
5
  • 1
    $\begingroup$ When you refer to "time series clusters", do you mean a subset of time series are more correlated than others? Or are you just trying to quantify a large "on average" drop? $\endgroup$
    – AdamO
    Commented Apr 6, 2020 at 15:11
  • $\begingroup$ I was originally thinking about a large drop on average, but any approach that results in a 4:1 and not 3:2 grouping is welcome. $\endgroup$ Commented Apr 6, 2020 at 15:22
  • $\begingroup$ This "grouping" method isn't clear, and has nothing to do with the question. Maybe, just maybe, you're sensing the challenge in not having a control series with which to compare. Matching doesn't synthesize a control, especially not in those data plotted. I think the approach most would advocate would be to implement some type of filtering process along with prediction bounds and detect if the time series drops (or ascends) beyond those bounds. A Kalman Filter or Bayesian Particle Filter come to mind... but TS experts would have to chime in on that. $\endgroup$
    – AdamO
    Commented Apr 6, 2020 at 15:27
  • $\begingroup$ I'll take a look at it. I didn't mean the grouping method (like k-means or dbscan) itself, and I'm not looking for it right now. What I would like to get is a mathematical tool that makes the red series be away, different etc. (because of the drop) from the other series. In some way it's numerical value or distance from others should be different / far because of the drop. $\endgroup$ Commented Apr 6, 2020 at 15:35
  • $\begingroup$ The problem is you singled out the red series because you plotted it and singled it out for a particular reason. You can't use the same data that generated a hypothesis to test a hypothesis. $\endgroup$
    – AdamO
    Commented Apr 6, 2020 at 15:51

2 Answers 2

2
$\begingroup$

One approach would be to hand-engineer feature(s) that represents the characteristics that you care about. In this case you could try computing the moving median over maybe 5 steps, then for each time-step compute the difference to this median, and take the max of these differences across the entire series.

Another approach would be to use an Anomaly Detection algorithm. This has the benefit that it can also detect new kinds of abnormalities. Autoencoders are usually the best for time-series. For this you'd need to prepare a dataset with only "normal" data, to train on.

$\endgroup$
0
$\begingroup$

DTW is perfect for this, see examples at https://www.cs.unm.edu/~mueen/DTW.pdf

$\endgroup$
1
  • $\begingroup$ I don't think this is a perfect case for dtw. From what I've read dtw comes in handy when you deal with series that have different length and/or are somehow shifted in time. In my case their are neither unlike length nor shifted in time. Moreover, the sudden drop is unique to the red line, so I can't see how dtw could catch it. $\endgroup$ Commented Apr 7, 2020 at 6:18

Your Answer

By clicking “Post Your Answer”, you agree to our terms of service and acknowledge you have read our privacy policy.

Not the answer you're looking for? Browse other questions tagged or ask your own question.