1
$\begingroup$

I'm learning some time series analysis and forecasting techniques, I've tried to predict stock prices for Netflix but I'm very confused.

At first I've tried Auto ARIMA which gave me a straight line, obviously it's a bad fit, then I tried a linear regression between X(t) and it's lagged version, I've plotted a lag plot and saw that there is a very strong correlation between X(t) up to X(t-10) so I trained a linear regression model using X(t-1)...X(t-6) as features (predictors) and X(t) as a target.

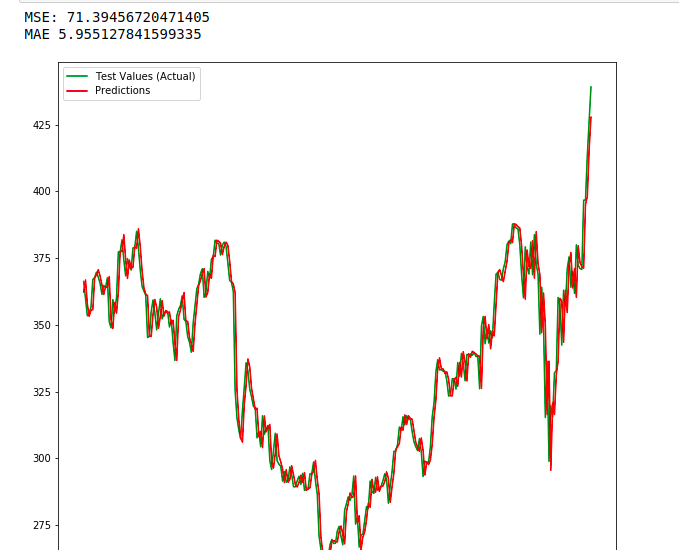
I've compared the predictions next to the test set and the results were quite shocking, the model was nearly perfect and predictions were almost equal to actual values in the data set.

The MAE is only 6.25 (6.25 dollars off in average).

Next I tried another ML technique which is the Gradient Boosting Trees algorithm and results were as perfect as the linear regression model, you can see the results here

enter image description here

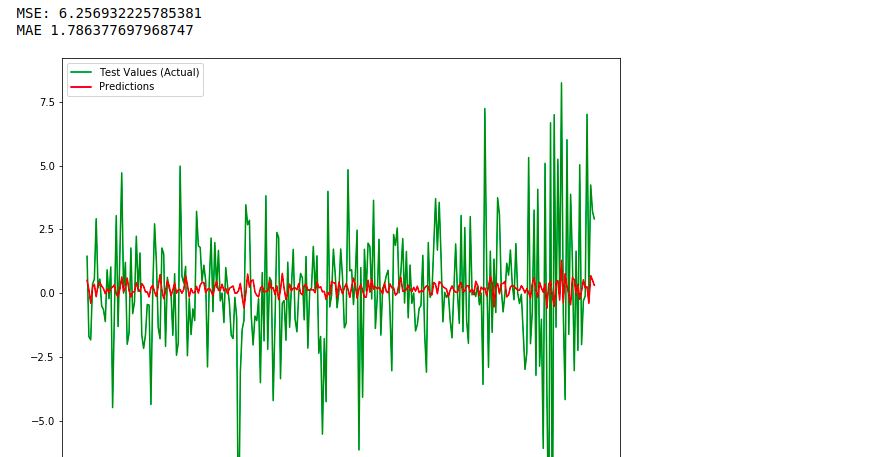
So I was thinking that something was wrong and I tried changing my variable, this time instead of using closing prices I used returns (using both algorithms) and the results were very bad and very off as you can see here:

enter image description here

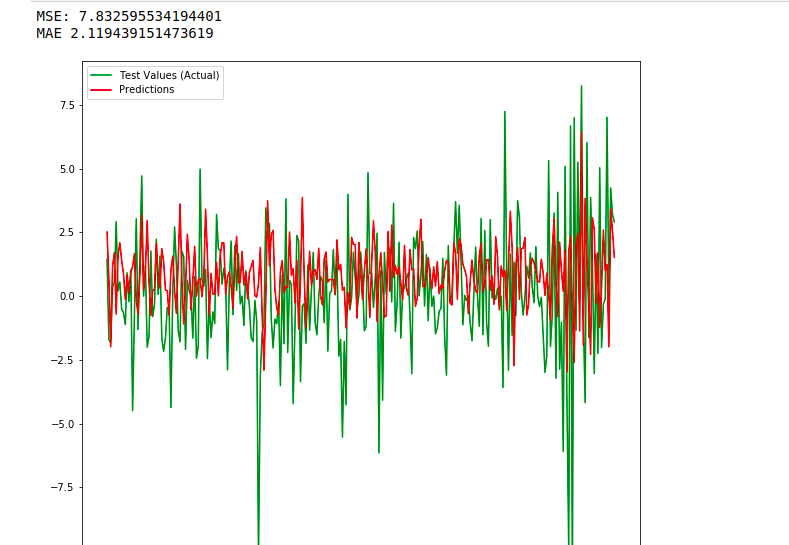
and this is when I multiply predictions by 10:

enter image description here

These results are very confusing for me, I'm wondering why am I fitting the closing prices almost perfectly while returns are modeled quite badly ? and most importantly What's the recommended approach to predict stock prices ?

Note: I already know that returns are stationary while closing prices tend to not be, but is this important ? and If so why ?

Thank you !

$\endgroup$
1
  • $\begingroup$ See this and this and look for the word "vertical". $\endgroup$ Commented Apr 20, 2020 at 9:48

1 Answer 1

2
$\begingroup$

The confusion stems mainly from the predicted vs actual plot for the prices, which is a common source of confusion and not particularly useful in any case for time series problems in general.

If you take a closer look, you'll see that your forecasts "look like" the actuals but that they lag behind them. That's because your forecast hasn't really captured any structure at all: your forecast is essentially the current value plus some tiny, meaningless adjustment coming from your complicated model. The proof of this is how bad the forecast in terms of returns is. The random walk probably does just about the same as the more complicated models.

This is actually about the best you can expect from trying to forecast stock prices based on their history alone. Due to the way collective expectations about future stock prices quickly feed back into their current value, there is in general little to no "forecastable" part that remains. This is a fundamental property of the application domain. If you are interested in learning how forecasting works, it might be more fruitful to look at other application domains.

One alternate approach is to consider related information (other than the price itself) which is private, or which is not private but not widely known to be related to the performance of a particular stock (which could be literally anything until enough people find out about it). There are others.

$\endgroup$

Your Answer

By clicking “Post Your Answer”, you agree to our terms of service and acknowledge you have read our privacy policy.

Not the answer you're looking for? Browse other questions tagged or ask your own question.