3
$\begingroup$

I saw a couple of questions, very similar but unfortunately without any answer e.g.here and here. I aim to make it clear here with a dummy data hopefully, to receive some guidance

I would like to investigate the effect of a treatment on a group of patients. These patients have been measured by 16 measurements (ultrasound imaging) before receiving a drug and one year after. Therefore, we have around 32 measurements.

Here is a dummy data with 6 patients and three measurements. columns ending with "_0" indicate before treatment and "_end" for afterwords. Similar to other clinical studies the question is whether the treatment has significantly changed initial measurements.

ptid,group,a_0,b_0,c_0,a_end,b_end,c_end
1,0,29,18.75,22,18.75,29,37
2,0,37,34.72,37.82,34.72,37,39
3,0,39,21.22,21.01,21.22,39,25
4,1,25,22.88,12.37,22.88,25,24
5,1,24,15,16,15,24,30
6,1,30,20,10,20,30,12

and my code so far is as following

tt = read.csv("~/Downloads/_tmp.csv")
rownames(tt) =tt$PtID

experiment_start = tt %>% select("ptid", "group", ends_with("_0"))
experiment_start.melt = melt(experiment_start,  id.vars = c("ptid", "group"))
experiment_start.melt$Time = rep("start", nrow(experiment_start))

experiment_end = tt %>% select("ptid", "group", ends_with("_end"))
experiment_end.melt = melt(experiment_end,  id.vars = c("ptid", "group"))
experiment_end.melt$Time = rep("end", nrow(experiment_end))

df.tot = rbind(experiment_start.melt, experiment_end.melt)
colnames(df.tot)[2] = "Treatment"

my.measurements = gsub("_0", "", df.tot$variable)
my.measurements = gsub("_end", "", my.measurements)

df.tot$measurement = my.measurements

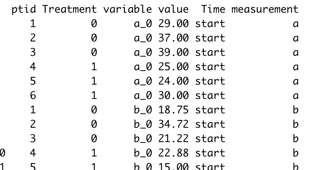
so now the data looks like

enter image description here

res.aov = aov(value ~ Treatment, data = df.tot)

Basically, I am not sure what should be the anova formula. I know Time is a factor, but is it interacting (Treatment * Time) with the treatment ? or is it just an addition factor (Treatment + time). I appreciate if you guide me on this. In addition how the formula differs if I use a linear mixed model to perform this test ? To add random effect, e.g. gender or age should I include it as | age + gender

** UPDATE I

These 16 measurements are spatial information of echocardiogram wave. Basically the wave shows a beating heart and motion of the heart during 1 heart cycle/beat. We quantify them into 16 points (beginning some specific peaks and etc).

Reason why we want to examine all the parameters is that we are not sure whether medicine is going to have influence on the passive (start of the curve ), peak or plateau of the curve.

Main question is how to conduct a test to investigate whether the echocardiogram of patients have significantly changed after taking the medicine.

** UPDATE II

The measurements show different times during one heart beat. However: one of the measurements display strain during one heart beat in septum, while the other display global measures from the whole chamber during one heart beat. LS has unit %: how much % the heart muscle moves, LSR has 1/s: how fast the heart muscle moves, D (displacement) has unit mm: how long (in mm) heart muscle moves.

$\endgroup$
11
  • $\begingroup$ Since you have a matched pairs of before and after, then testing the difference is a better test than comparing the raw values. Also since you have different measurements from each individual, are they normalized to each other? Differences in heart rate to hat size will hide any signal from treatment. It may make more sense to preform a t-test on the differences between the treatment and control for each measurement. $\endgroup$
    – Dave2e
    Commented Apr 24, 2020 at 21:25
  • $\begingroup$ 1) so you recommend not using anova or rather adding t-test too ? can you elaborate please why not! 2)very good point - no ! I think you are right that each sensor should be normalized - how would you normalize ? do you do it across all patents ? or normalized within each (before / after / control / case). Thank you again. $\endgroup$
    – Areza
    Commented Apr 24, 2020 at 21:54
  • $\begingroup$ I took a look at the data, df.tot$Time=factor(df.tot$Time,levels=c("start","end")) ; ggplot(df.tot,aes(x=factor(Treatment),y=value,fill=Time))+facet_wrap(~measurement) + geom_point(position=position_jitterdodge()) + geom_boxplot(alpha=0.3) $\endgroup$
    – StupidWolf
    Commented Apr 24, 2020 at 22:01
  • 1
    $\begingroup$ Are the 16 pre (and 16 post) measurements all of the same type so that they can effectively be averaged pre and post, or are these 16 different types of measurements so that you want to examine differences for each of them? $\endgroup$
    – EdM
    Commented Apr 24, 2020 at 22:07
  • 1
    $\begingroup$ For those of us who aren't experts in echocardiography, could you please say how your measurements correspond to the principles in this explanation (2D versus M-mode versus Doppler)? I'm still not clear about how the 16 measurements correspond to differences in anatomic location versus time. You specify start, peak, and plateau (which sound like 3 different times). Are there 5 anatomic regions with measurements at each of those times, 16 measurements in time at a single anatomic location (then grouped into start, peak, plateau), or what? $\endgroup$
    – EdM
    Commented Apr 27, 2020 at 16:03

2 Answers 2

3
$\begingroup$

You have two major sets of issues here: how to set up the analysis for a single type of observation, and how to deal with having multiple correlated observations. Let's look at those one at a time.

Modeling one type of observation

To start let's say for simplicity that there is only 1 type of echocardiographic measurement (Call it Echo1) taken at the beginning (Echo1_0) and at the end (Echo1_end), and that you want to evaluate the effect of treatment on that measurement while you account for covariates like age and gender. Age and gender aren't "random effects" in the technical sense; "random effects" represent inter-individual differences (typically unknown, just modeled by some distribution) beyond those accounted for by simple specified variables like those.

With 1 measurement at the beginning of the study and 1 at the end, the analysis might work well on paired differences, as @Dave2e suggests in another answer. (A more complicated design might require more sophisticated repeated-measures analysis.) So for each individual you calculate the post-pre difference (PPD = Echo1_end - Echo1_0), and use that as your outcome variable. That way, the Time variable is removed from the analysis. If you want to take other covariates into account you need to go beyond a simple ANOVA. You could write a linear model like the following:

lm(PPD ~ treatment + gender + age, data = df.tot)

to give you an estimate of the effect of treatment on PPD while allowing for additive effects of gender and age on the PPD. The usual rule of thumb is about 15 observations per coefficient that you are estimating, so you would need on the order of 50 patients to do this reliably. You seem to be worried about meeting requirement of normality for this type of test, but the issue isn't normality of observations per se, it's the normality of the deviations from the values estimated from the model. That can be checked and I suspect either won't be much of a problem or can be resolved by some transformations of the measurements (e.g., fractional changes rather than absolute differences).

There might be something to be gained by modeling the individual Echo1 measurements, both Echo1_0 and Echo1_end separately. Then you would have to use a treatment*Time term in your model, as the simple additive treatment + Time would assume that the Echo1 values differed between treatment and control groups by the same amount at both Time_0 and Time_end, and that the (Time_end - Time_0) differences were the same for both treatment and control groups. That's clearly not what you expect from your study. To include covariates in that modeling, you would have to decide whether you just wanted to know their association with Echo1_0 values (just additive terms in the model) or also with changes with time or treatment effects (requiring interaction terms). To regain some of the advantages of paired analysis you could include a random effect for subject (1|subject) that allows and corrects for differences in estimated baseline values in a mixed model.

Modeling multiple types of observations

The principles above apply to any single type of observation, but having 16 observations leads to both some potential complications and advantages.

If you did separate models for each of your 16 types of observations, you would have to correct for multiple comparisons. Running 16 separate tests at p < 0.05 means better than a 50% chance of finding at least one false positive result. If the effects aren't extremely large then correcting for a large number of hypothesis tests might lessen your ability to detect true differences.

One way to proceed is to use your knowledge of the subject matter to combine some measurement types into single outcome measures. For example, it seems that results on speed and displacement might be closely related and could be combined in some way. Or you could find some way to combine all of the measurements within each of the passive, peak, and plateau parts of the cycle so that you are down to testing only 3 effective outcomes, one for each part of the cycle. Check with published reports in the literature to get clues on how others have modeled these types of echocardiogram measurements. Using your knowledge of the subject matter has advantages in terms of explaining to a wide audience of your peers just what you have done.

Another would be to let the data tell you which measurements tend to track together, to model changes in principal components of the set of outcome measurements as you mention in a comment. I don't have any experience with that. I think that you would need to do PCA on the entire set of observations to get the eigenvectors, then see how the projections onto some of the most prominent eigenvectors change between Time_0 and Time_end. Note that this is different from what you usually read with respect to PCA regression, in which PCA is used to diminish the dimension of the predictor space. Here you want to diminish the dimension of the outcome space.

The second approach is related to partial least squares (PLS) regression. Again, many examples and implementations of PLS tend to emphasize reduction of the predictor space (and I don't have personal experience with PLS), but it was designed to deal with both predictor and outcome spaces so you might find that to be a way to proceed.

$\endgroup$
1
$\begingroup$

To answer your question and expand on my comment:

Since you have a matched pairs of before and after, then testing the difference is a better test than comparing the raw values. Also since you have different measurements from each individual, are they normalized to each other? Differences in heart rate to hat size will hide any signal from treatment. It may make more sense to preform a t-test on the differences between the treatment and control for each measurement.

1) So you recommend not using anova or rather adding t-test too? Can you elaborate please why not!
Not understanding you you are measuring or what the hypothesis is makes this difficult to answer. As per my comment, most likely the measured values are less important than the changes from the pre to post. Performing a single anova test you will be looking at the combined interactions of all of the measurements and that of the treatment. This could be good as a first pass, but some measurements points may respond differently between treatments and non treatments so by performing a t-test on just those measurement points could provide more insight than looking at all 16 together.

2) I think you are right that each sensor should be normalized - how would you normalize?
R has the built-in R function, which basically converts the values to the z-score. I would perform this on each the delta of each measurement individually. An another option to convert everything into a 0 to 1 scale (subtract the minimum and divide by the range).

Good luck.

$\endgroup$
1
  • $\begingroup$ Thanks @Dave2e - I added a bit more about the measurement in the questions. $\endgroup$
    – Areza
    Commented Apr 25, 2020 at 18:47

Your Answer

By clicking “Post Your Answer”, you agree to our terms of service and acknowledge you have read our privacy policy.

Not the answer you're looking for? Browse other questions tagged or ask your own question.