The Kolmogorov-Smirnov test assesses the hypothesis that a random sample (of numerical data) came from a continuous distribution that was completely specified without referring to the data.
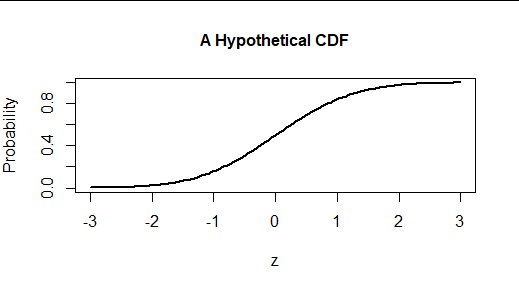
Here is the graph of the cumulative distribution function (CDF) of such a distribution.
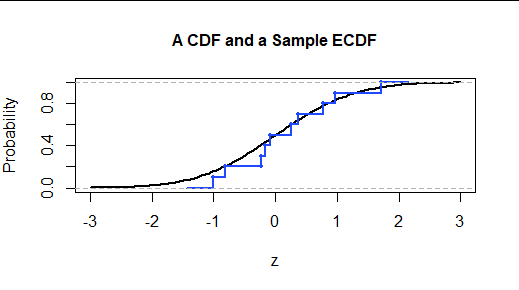
A sample can be fully described by its empirical (cumulative) distribution function, or ECDF. It plots the fraction of data less than or equal to the horizontal values. Thus, with a random sample of $n$ values, when we scan from left to right it jumps upwards by $1/n$ each time we cross a data value.
The next figure displays the ECDF for a sample of $n=10$ values taken from this distribution. The dot symbols locate the data. The lines are drawn to provide a visual connection among the points similar to the graph of the continuous CDF.
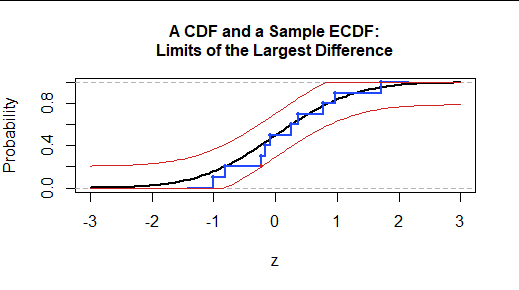
The K-S test compares the CDF to the ECDF using the greatest vertical
difference between their graphs. The amount (a positive number) is
the Kolmogorov-Smirnov test statistic.
We may visualize the KS test statistic by locating the data point situated furthest above or below the CDF. Here it is highlighted in red. The test statistic is the vertical distance between the extreme point and the value of the reference CDF. Two limiting curves, located this distance above and below the CDF, are drawn for reference. Thus, the ECDF lies between these curves and just touches at least one of them.
To assess the significance of the KS test statistic, we compare it--as usual--to the KS test statistics that would tend to occur in perfectly random samples from the hypothesized distribution. One way to visualize them is to graph the ECDFs for many such (independent) samples in a way that indicates what their KS statistics are. This forms the "null distribution" of the KS statistic.
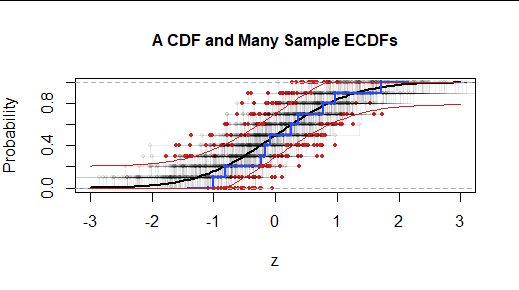
The ECDF of each of $200$ samples is shown along with a single red marker located where it departs the most from the hypothesized CDF. In this case it is evident that the original sample (in blue) departs less from the CDF than would most random samples. (73% of the random samples depart further from the CDF than does the blue sample. Visually, this means 73% of the red dots fall outside the region delimited by the two red curves.) Thus, we have (on this basis) no evidence to conclude our (blue) sample was not generated by this CDF. That is, the difference is "not statistically significant."
More abstractly, we may plot the distribution of the KS statistics in this large set of random samples. This is called the null distribution of the test statistic. Here it is:
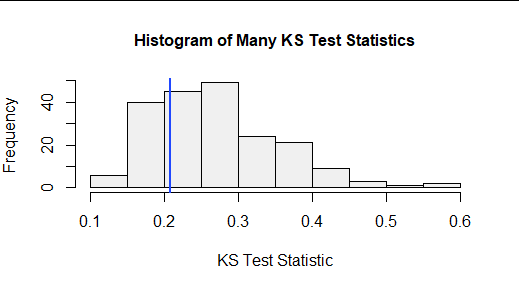
The vertical blue line locates the KS test statistic for the original sample. 27% of the random KS test statistics were smaller and 73% of the random statistics were greater. Scanning across, it looks like the KS statistic for a dataset (of this size, for this hypothesized CDF) would have to exceed 0.4 or so before we would conclude it is extremely large (and therefore constitutes significant evidence that the hypothesized CDF is incorrect).
Although much more can be said--in particular, about why KS test works the same way, and produces the same null distribution, for any continuous CDF--this is enough to understand the test and to use it together with probability plots to assess data distributions.
In response to requests, here is the essential R code I used for the calculations and plots. It uses the standard Normal distribution (pnorm) for the reference. The commented-out line established that my calculations agree with those of the built-in ks.test function. I had to modify its code in order to extract the specific data point contributing to the KS statistic.
ecdf.ks <- function(x, f=pnorm, col2="#00000010", accent="#d02020", cex=0.6,
                    limits=FALSE, ...) {
  obj <- ecdf(x)
  x <- sort(x)
  n <- length(x)
  y <- f(x) - (0:(n - 1))/n
  p <- pmax(y, 1/n - y)
  dp <- max(p)
  i <- which(p >= dp)[1]
  q <- ifelse(f(x[i]) > (i-1)/n, (i-1)/n, i/n)

  # if (dp != ks.test(x, f)$statistic) stop("Incorrect.")

  plot(obj, col=col2, cex=cex, ...)
  points(x[i], q, col=accent, pch=19, cex=cex)
  if (limits) {
    curve(pmin(1, f(x)+dp), add=TRUE, col=accent)
    curve(pmax(0, f(x)-dp), add=TRUE, col=accent)
  }
  c(i, dp)
}


