I want to find patterns in a time series and use clustering for that. Before I cluster, I create subsequences from the time series using a sliding window approach. (STS-clustering)
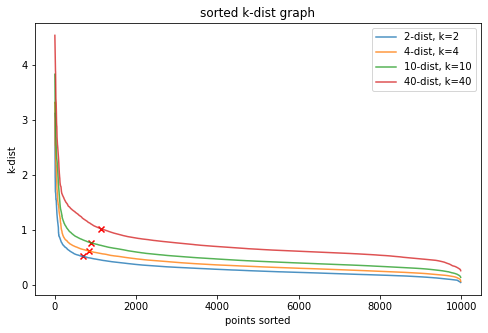
So far I have tried DBSCAN and tried to determine the parameters for eps and min_samples using the methods suggested in this paper, which basically calculates the k-th nearest distances for each points, sorts them and then plots the curve of the sorted points. The desired params (according to the paper) would then be
min_samples = k
eps = y-value at the knee of the curve
This is this curve for my data:
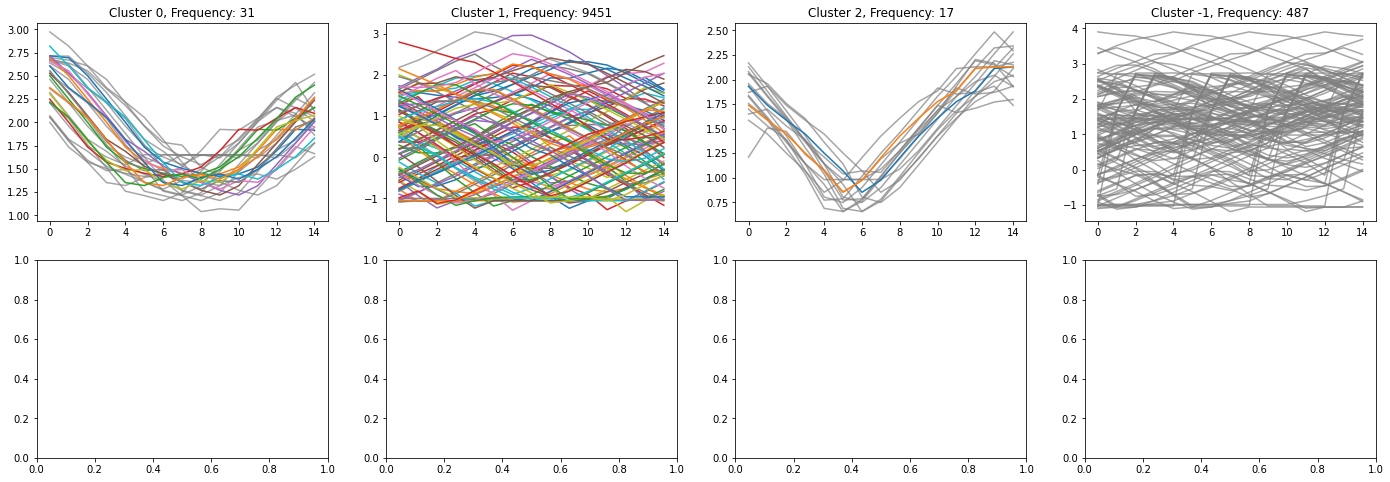
Setting eps=0.76 and min_samples=10 gives me these clusters of my time series:
I can still see a lot of similar lines in cluster 1, which could be seperated into further clusters.
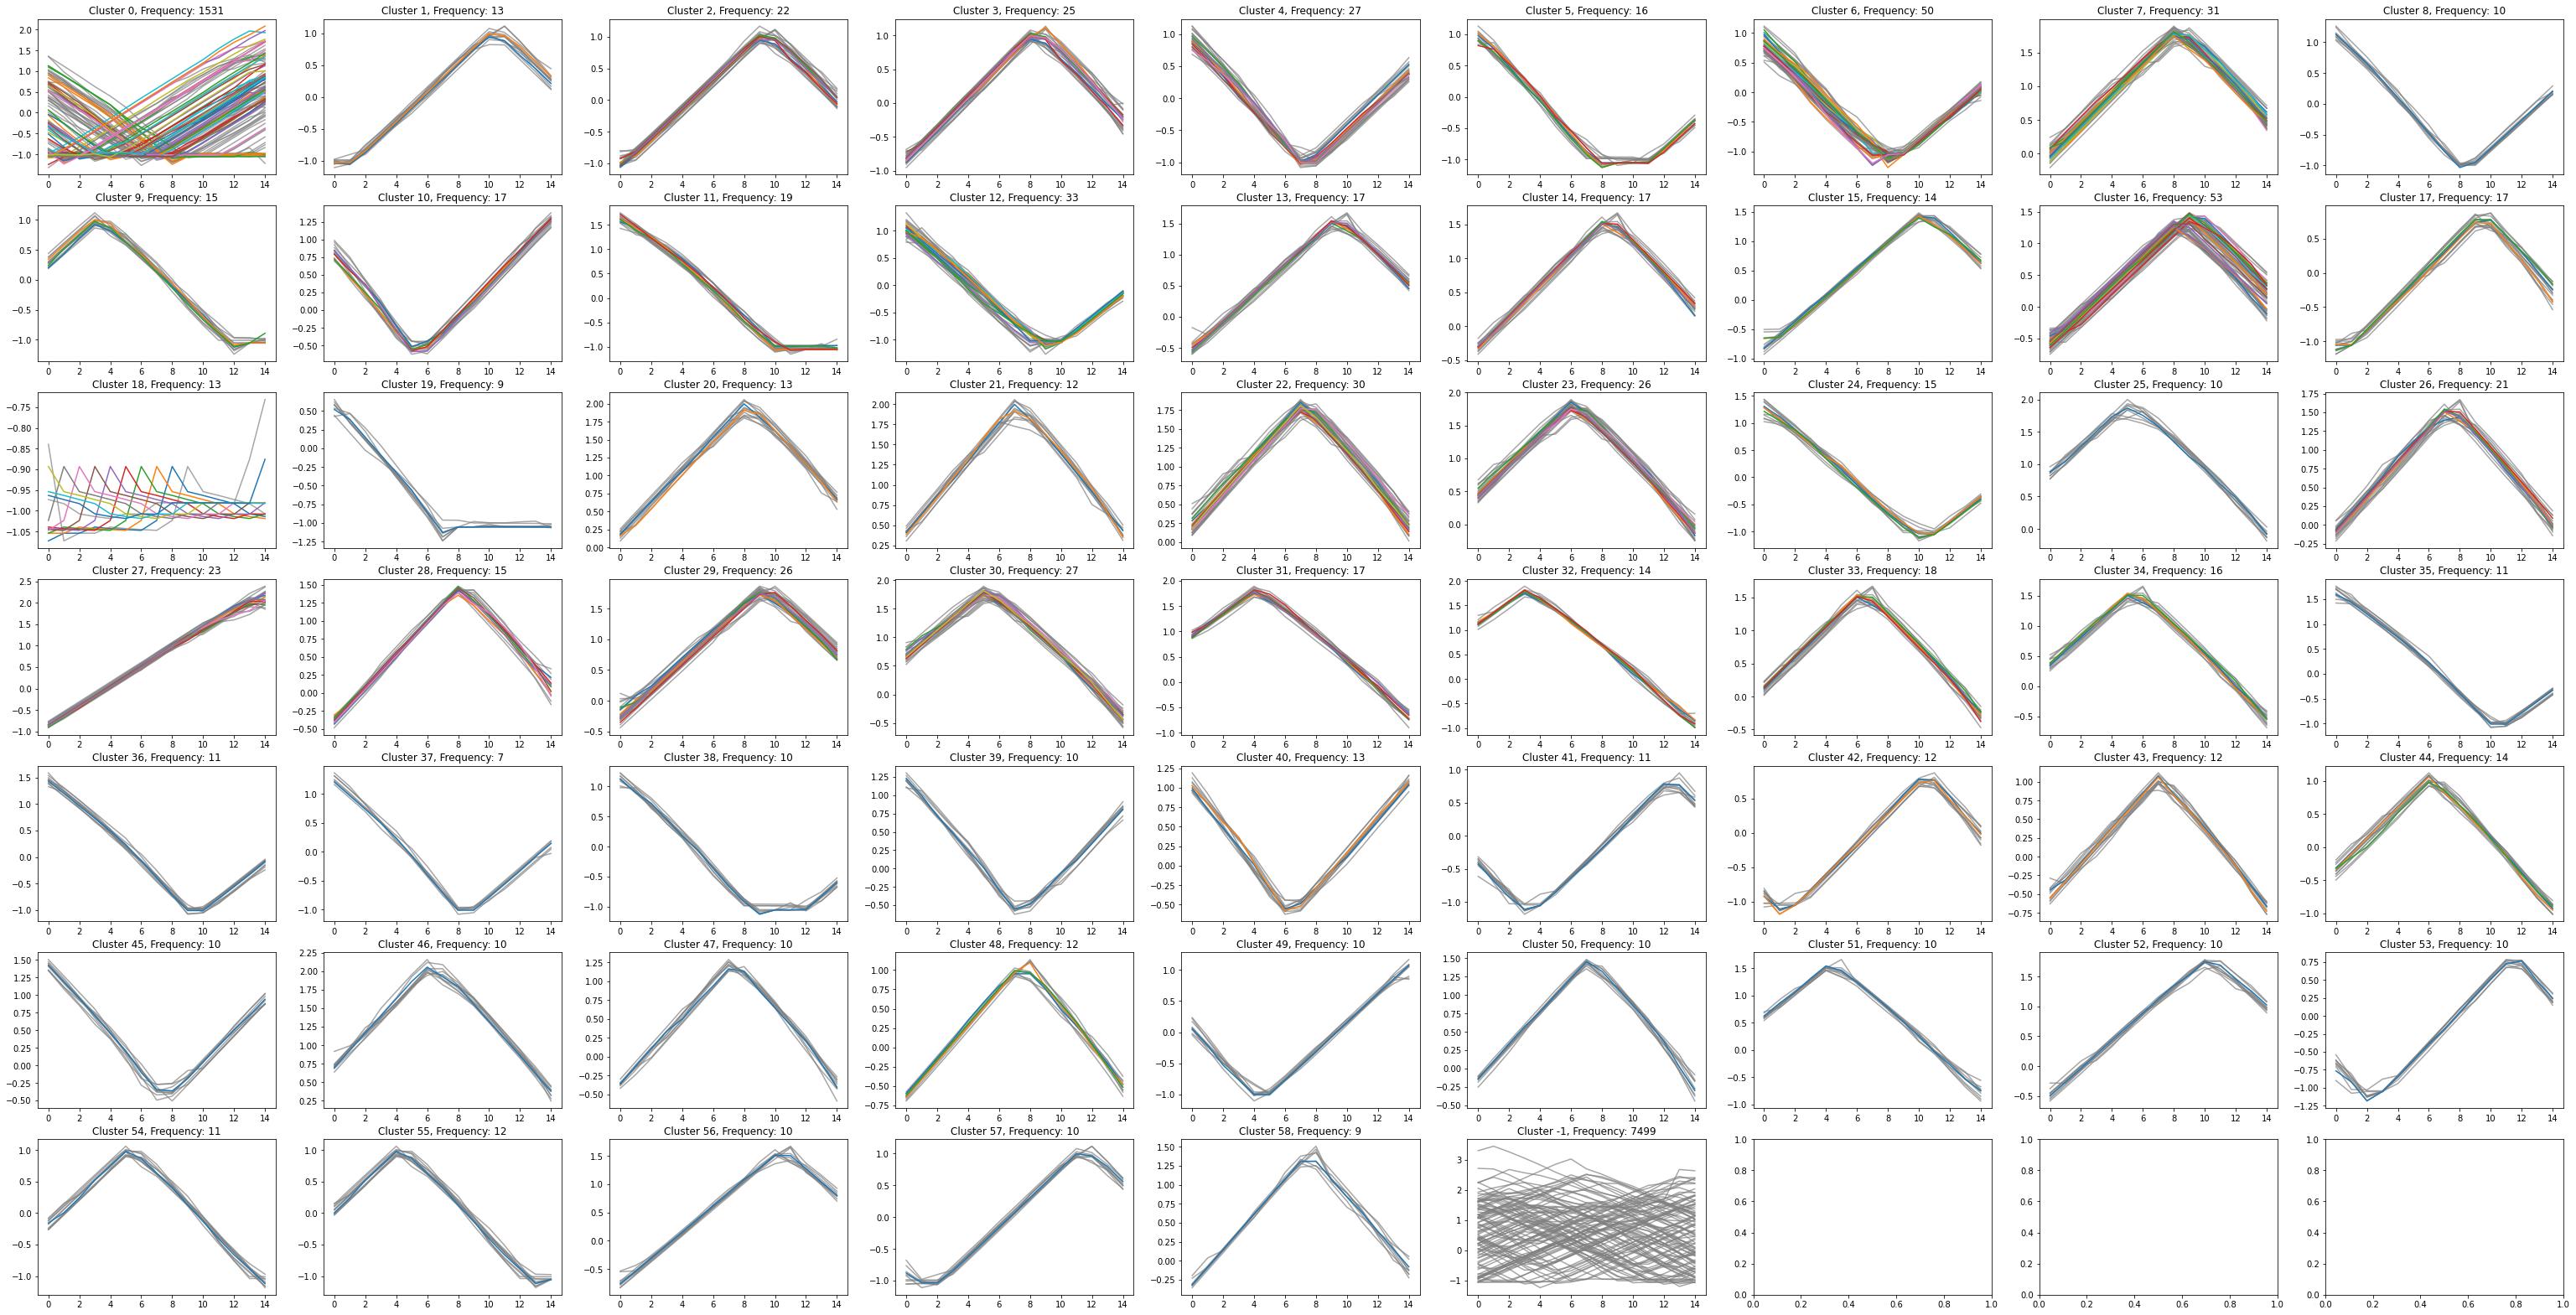
When I decrease eps to eps=0.3 and min_samples=10, I get a more sensible graph:
However now I get a lot of clusters, which actually look quite similar (e.g. cluster 1, 2 and 3). This, I expect, is partly because the time series was split into subsequences which "overlap". Ideally though, I would like to combine these similar clusters into a single cluster.
I can also specify the metric for the DBSCAN. So far I have stuck to euclidian, because its computation is very quick. I read, that DTW (DynamicTimeWarping) is a desired metric to use. However, using DTW in DBSCAN is VERY slow. Therefore I cannot rerun it over and over to discover good parameters for the problem.
Can you suggest me a method for discovering good parameters for the DBSCAN, particularly for time series or subsequence time series data? For which k should I construct the k-dist plot? Also I do not know, if this is a good way to find the parameters in the case of time series data, because the curve changes depending on the number of datapoints/ length of my time series from which I construct the plot.
Also what would be a good metric to use for time series data clustering?


