My question is:
Is there any multi-level method or library, preferably in R, that will predict a negative binomial outcome from multiple covariates and a “moderator," and then report on the statistical significance of the fixed-effects in the original space (i.e. without log transformation), so that we can report the significance of the actual differences rather than the relative differences?
Here’s a bit more detail:
My team has a multi-level dataset that consists of a zero-inflated negative binomial outcome variable, multiple variables representing “time,” several covariates, and our study variable. The study variable is numeric between 1 and about 3, but can be grouped into “Low,” “Medium,” and “High” groupings. Our study has 3 periods or phases, so we have chosen a discontinuous longitudinal growth modeling approach (see Bliese & Lang, 2016). ICC values associated with the outcome variable and the grouping variable suggest a multi-level analysis would be appropriate, and the skewed/negative binomial distribution of the outcome suggests a log transformation or a negative binomial analysis (such as provided by glmer.nb, in R) would be useful. Indeed, a log transformation of our outcome variable creates distributions that are quite normal. Initially we supposed that either of these methods (log transformation or using glmer.nb) would give us the answers we sought, and in truth the outcomes for the two approaches are fairly similar. However, in both cases we’ve run into the following issue which we are trying to resolve:
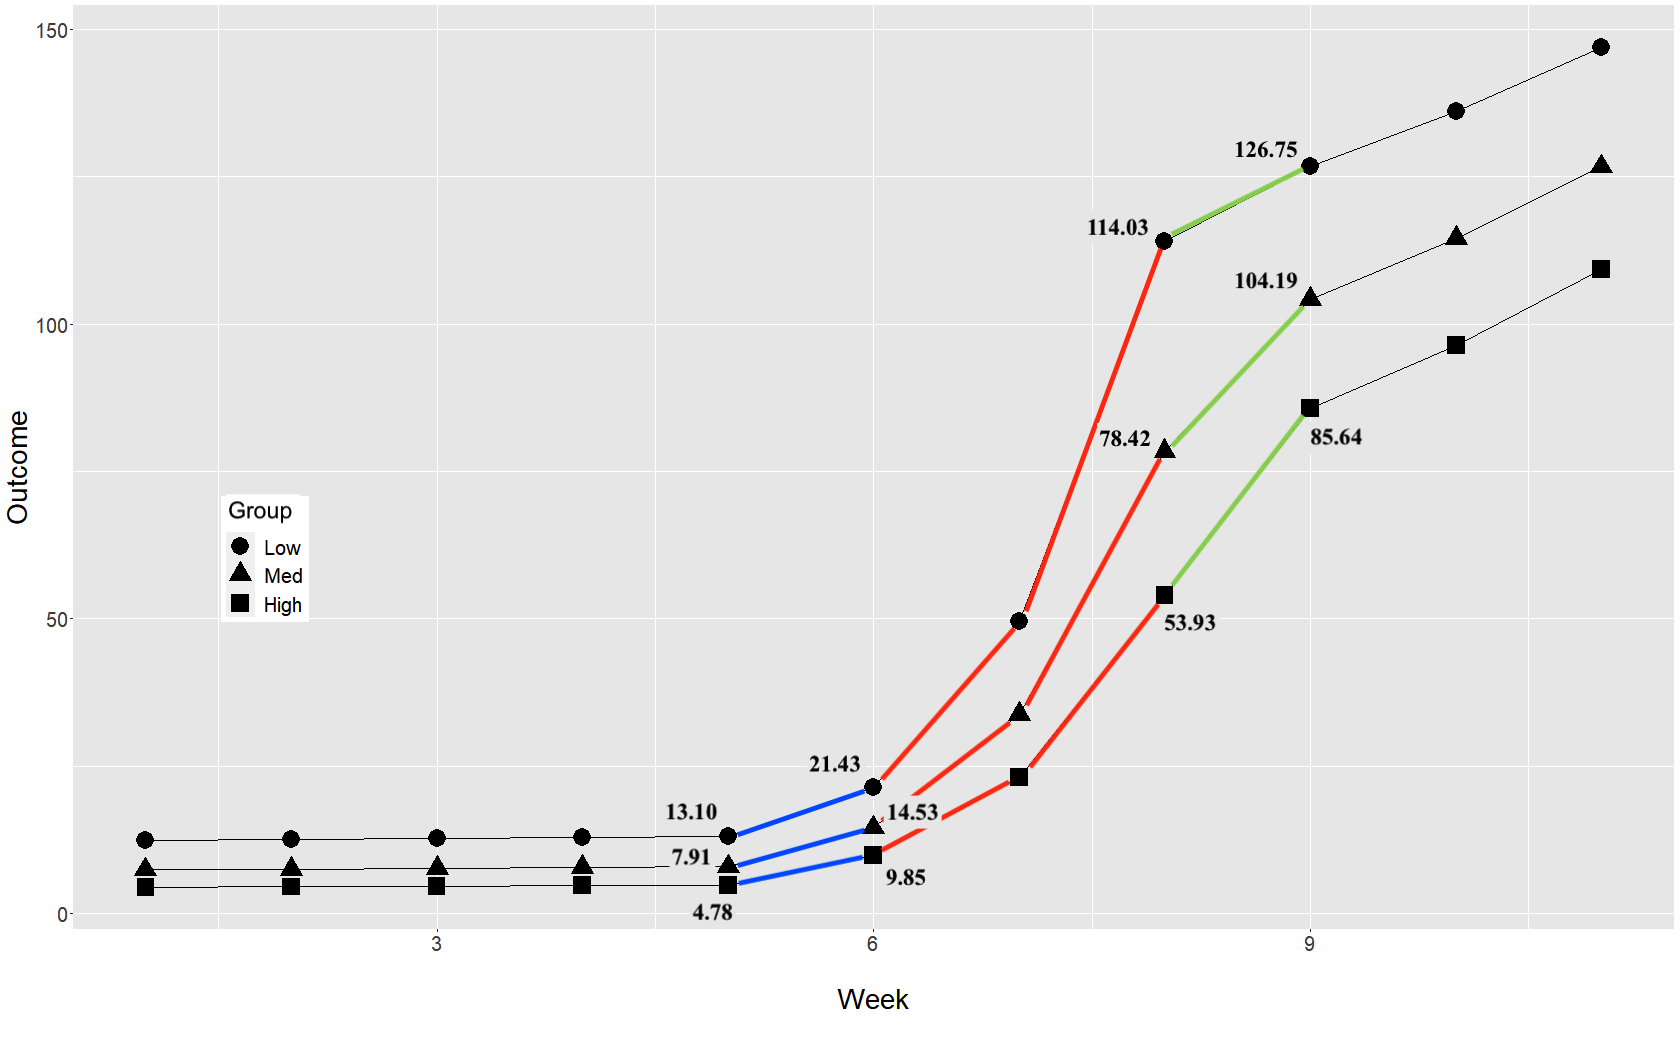
Our results from glmer.nb in R, when exponentiated, closely model the actual data and look something like this—
In the initial stage of the study, all three groups of the study variable are associated with relatively low outcomes, although the “Low” group shows somewhat higher results (13.10 vs 4.78, for example). During the first transition (blue lines), predicted outcomes roughly double. Then, during the second stage (red lines), predicted outcomes increase over 5-fold, but importantly for this study, by the end of the second stage the absolute increase in outcome for the “Low” group is more than 2x the increase for the “High” group. During the second transition (green lines), the “High” group appears to do a little catching up, but ultimately the “Low” group maintains roughly a 40-point lead over the “High” group. This outcome, and the absolute changes in outcome in phase two, are important in the context of our study. (The parallel improvements in the subsequent third stage are not relevant for the questions in this particular study).
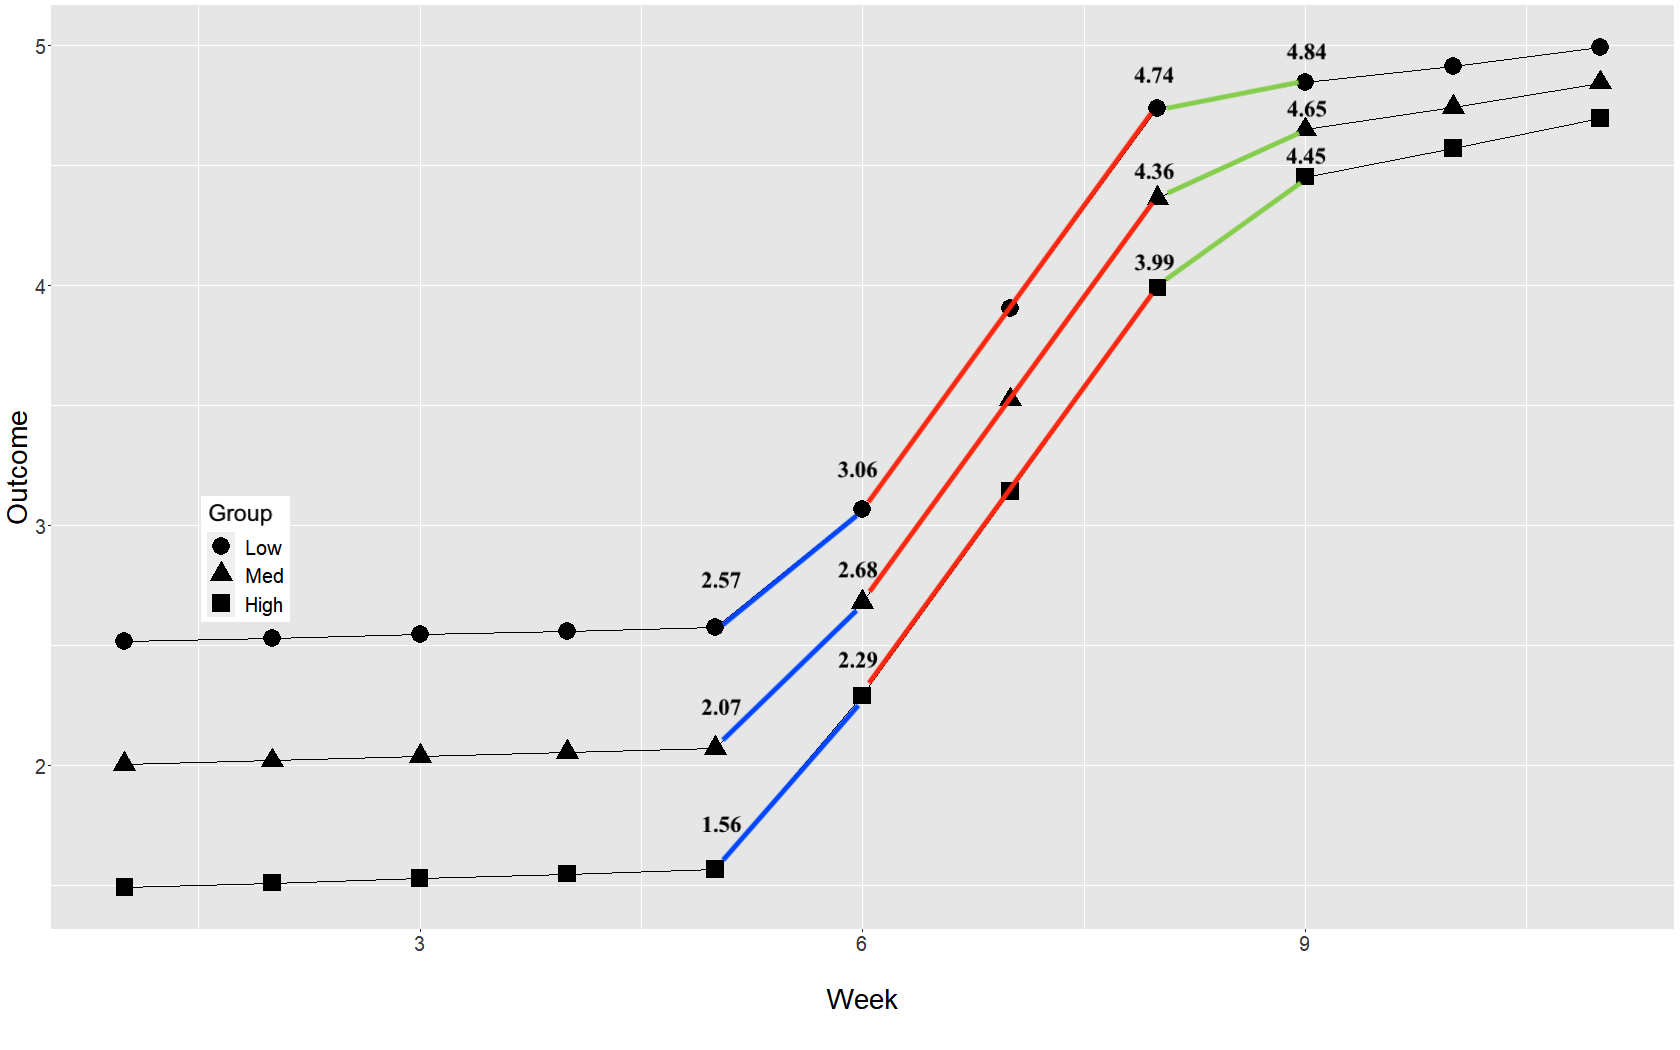
Visually, it may appear we have a compelling case. Numerically, however, we’ve hit a roadblock. When analyzing our data using glmer.nb or when log transforming our outcome (one of which seems necessary because of the negative binomial distribution of our outcome variable), the statistical analysis is no longer comparing absolute change but rather relative change, or percent change. The following image is potentially unnecessary but may be helpful.
This is a plot of the predicted outcomes before exponentiating the results. As you can see, what is illustrated here is different in a few key ways: the slopes of the three groups during phase two (the red lines) are nearly identical, and the final outcomes are MUCH closer together than the exponentiated / “real" outcomes. The trouble from our end is that this latter set of results constitutes the set being evaluated for statistical significance in glmer.nb. Importantly, in log-transformed space, the relative change during period two (the red lines) is the same for each level, so the differences between levels are not statistically significant. In many studies, reporting relative change might be satisfactory, but in ours the absolute values/changes are quite compelling.
So, again our question is —
Is there any multi-level method or library, preferably in R, that will predict a negative binomial outcome from multiple covariates and a “moderator," and then report on the statistical significance of the fixed-effects in the original space (i.e. without log transformation), so that we can report the significance of the actual differences rather than the relative differences? Or perhaps there is another approach we can take?
--- edit ---
Since posting I have realized this may be able to be broken down into a simpler problem. By running the glmer.nb analysis, we've been able to confirm the main effect of the "group" variable across the study period. The true slopes during the second stage (red lines) are all we're really interested in now. It's still a multi-level, multivariate longitudinal growth model, but if we only look at that stage it's no longer discontinuous.
I have been looking at using a Bayesian approach--specifically using the brms library in R (which invokes Stan)--but this idea is entirely foreign to me.


