5
$\begingroup$

I am trying to model a variable (maximum depth) as a function of type of dive and diel changes (day,night) with the individuals (whales in this case) as a random factor in R. I tried first to apply a linear mixed model (lme) and I had a problem of autocorrelation and non-normality of residuals. Next, I tried to apply a GLM with Poisson and negative binomial distributions. Both had the same problem of autocorrelation and/or non-normality of residuals.

What can I do to model these variables or to correct these issues?

Thank you.

Update

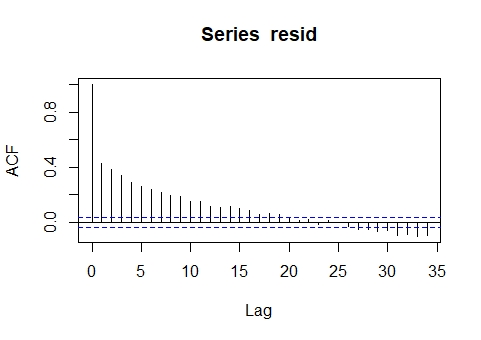
I tried using corAR1(correlation = corAR1(form = ~ 1 | whale)) but when I plot ACF, there is still a strong autocorrelation.

enter image description here

What can this mean and how could I proceed to solve it? I could not include time in the corAR1 function because of repeated diel values:

(Error in Initialize.corAR1(X[[i]], ...) :   covariate must have unique values within groups for "corAR1" objects)

Thanks!

$\endgroup$

1 Answer 1

5
$\begingroup$

Mixed models are often a good choice when you have repeated measures, such as here, within whales. lme from the nlme package can fit mixed models and also handle autocorrelation based on a AR(1) process, where values of $X$ at $t-1$ determine the values of $X$ at $t$.

$$ X_{t}=c+\varphi X_{{t-1}}+\varepsilon _{t} $$

The function corAR1 handles discrete time and corCAR1 handles continuous time. For example:

mod <- lme(..., correlation = corAR1(form = ~ 1 | id))` 

with equally spaced time intervals or:

lme(..., correlation = corAR1(form = ~ time | id))

where the time intervals are supplied by the time variable.

I tried to apply a GLM with Poisson and negative binomial distribution. Both had the same problem of autocorrelation and/or non-normality of residuals.

From your description, the outcome is continuous so a count model such as Poisson or negative binomial would not make sense

$\endgroup$
6
  • 1
    $\begingroup$ Here you can find some comparative analysis bbolker.github.io/mixedmodels-misc/notes/corr_braindump.html $\endgroup$
    – user289381
    Commented Jul 7, 2020 at 9:03
  • $\begingroup$ Hi Robert! Thanks for the input. I tried using corAR1 but it doesn't seem to solve the autocorrelation problem (if i'm interpreting the results well). I added the resulting acf plot to the post. If you have any other tip on how to proceed I would very much appreciate :) $\endgroup$ Commented Jul 7, 2020 at 10:50
  • 1
    $\begingroup$ You're welcome. Please can you edit the question and include the model code and also include the acf plot from the original model (before you added corAR1. Also take a look at the link that @ping posted just above here $\endgroup$ Commented Jul 7, 2020 at 11:10
  • $\begingroup$ Hi Robert, I put all the models and graphs in this question (link below) and included an explanation of the dataset stats.stackexchange.com/questions/475950/… $\endgroup$ Commented Jul 7, 2020 at 13:54
  • $\begingroup$ @CatarinaToscano OK, that's fine. In that case please consider marking my answer here as accepted and I can take a look at the new question a little later when I have time. $\endgroup$ Commented Jul 7, 2020 at 14:06

Your Answer

By clicking “Post Your Answer”, you agree to our terms of service and acknowledge you have read our privacy policy.

Not the answer you're looking for? Browse other questions tagged or ask your own question.