I've been looking through text books but unable to find a precise answer to this question, but it seems important so maybe I'm looking in wrong places. Imagine some population with a normal distribution of some characteristic $c$. Some proportion $f$ have a condition, and let's pretend it has in reality no link to $c$. A shoddy experimenter simply decides to dichotomize the distribution at some cut-off $x_{1}$, and compare the number of people with the condition in both groups. At $\alpha = 0.05$, there's a roughly 1 in 20 chance they're find a spurious significance with something like Fisher's exact test doing this.
Pretend they don't find anything significant, but they recast their net, and dichotomize at some other cut-off point, $x_{2}$, repeating the process again. If these were totally independent tests, their chances of at least one false positive result would be easily to calculate, but they are of course not. For example, if their $x_{1}$ was the 10th percentile, and $x_{2}$ the 15th percentile; the "new" first group contains 2/3 of the "old" first group, and the "new" second group contains 85/90 of the same elements as before.
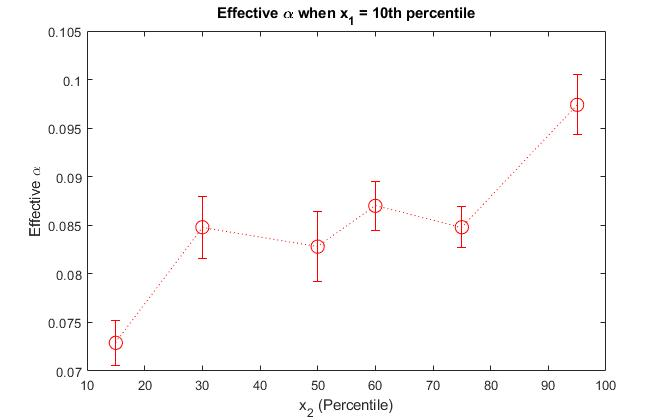
I can use simulation methods to ascertain the effective $\alpha$ that results depending on $x_{1}$ and $x_{2}$ chosen. However, I'm sure there much be a more elegant theoretical way to get this? I know such dictomization is poor practice, but I am coming across whole families of papers that do precisely this and want to know how much more likely these researchers are to find spurious results when they employ multiple dichotomization. Does anyone have any idea how to approach this? I've put up a graph below of the kind of results I get from simulation to illustrate, where $x_{1}$ is the 10th percentile and $x_{2}$ varies on x-axis. Any advice or input would be most welcome!

