1
$\begingroup$

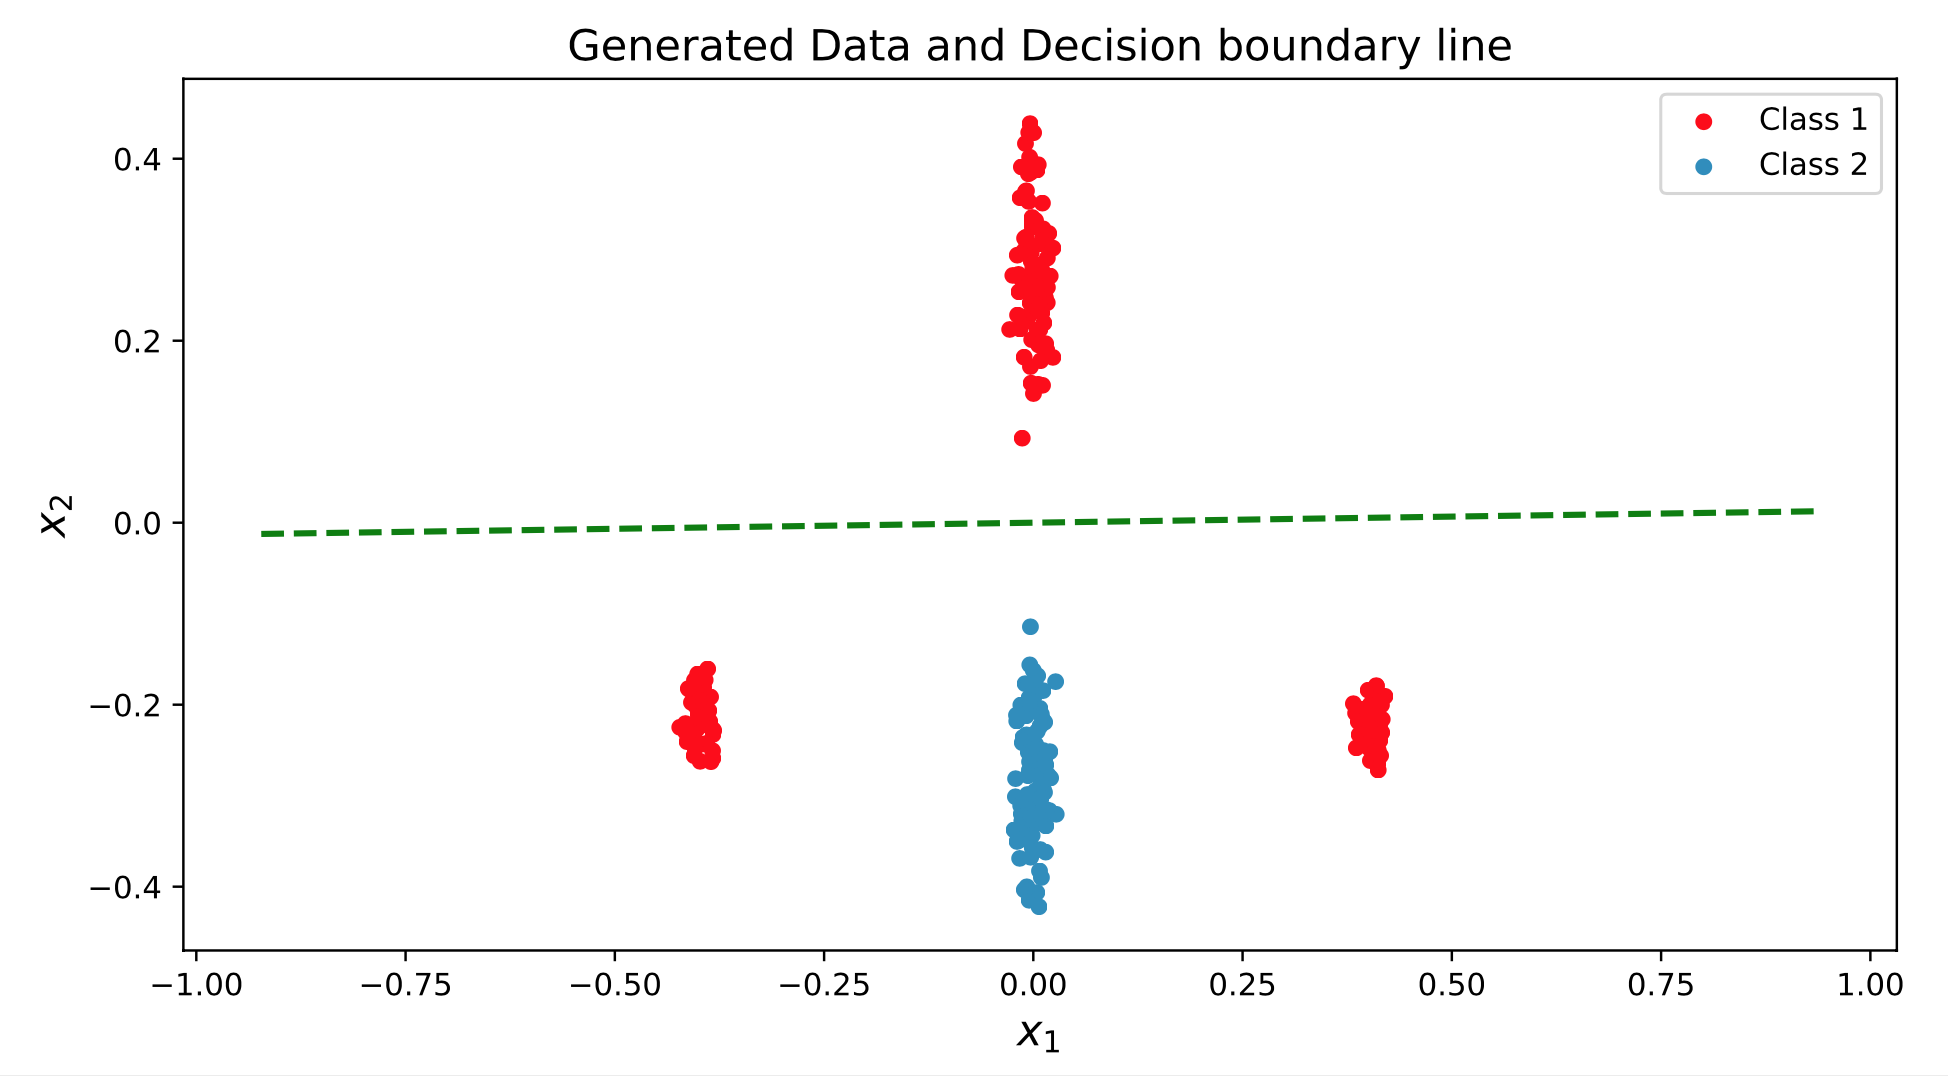
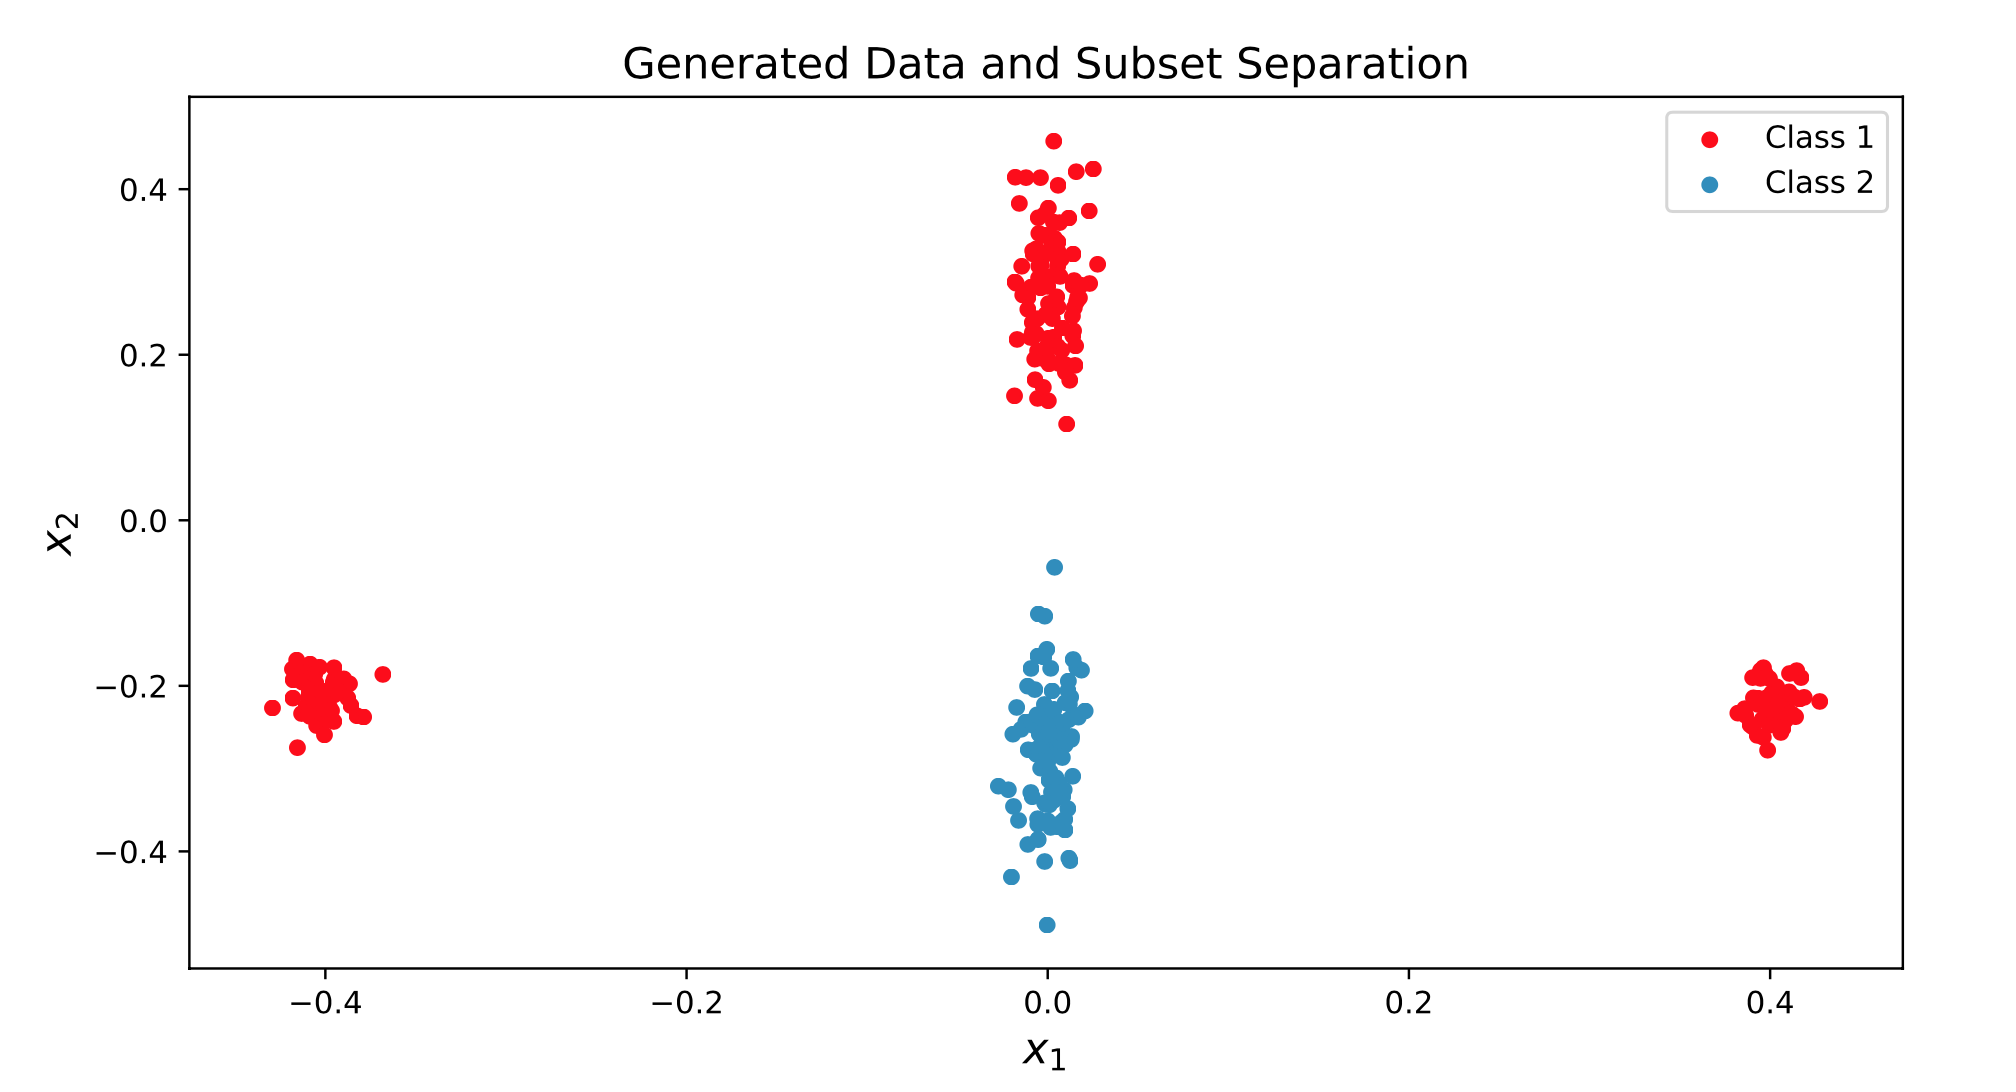
I have two classes that I would like to classify them by using logistic regression. But the decision boundary misclassify two of my red clusters the data

the decision boundary

My question is that why logistic regression classifies them wrongly and at least does not involve one of the small clusters? How they can be related to the term linear regression in the sigmoid function? How should I rearrange the red clusters to reduce the misclassification?

$\endgroup$
3
  • 1
    $\begingroup$ One way to improve the classification in such a case would be feature engineering, e.g. including x1 squared. $\endgroup$
    – nope
    Commented Jul 16, 2020 at 12:59
  • $\begingroup$ what do you mean by feature engineering? $\endgroup$
    – Raz
    Commented Jul 16, 2020 at 13:24
  • 3
    $\begingroup$ You already have x1 and x2 as input. Add $x_1^2$ as a third input to improve the result $\endgroup$
    – nope
    Commented Jul 16, 2020 at 13:44

3 Answers 3

4
$\begingroup$

First, recognize that logistic regression does not impose a decision boundary. It provides probabilities of class memberships. What you show as a "decision boundary" is presumably based on a cutoff of 0.5 in predicted probability for converting the probabilities into class assignments. Other cutoffs can be better if false-positive and false-negative assignments have different costs. That's very important to remember as you are learning about this.

Second, it doesn't look like a simple linear model based on $x_1$ and $x_2$ alone will do a good job of distinguishing these classes. You have 2 clusters of different classes around $x_1 = 0$, distinguished by their $x_2$ values. You have 3 clusters around $x_2 = -0.2$, with only the cluster also having $x_1 \approx 0$ in the blue class. In that case, even an interaction term between $x_1$ and $x_2$ wouldn't work to distinguish the 2 classes in the 3 lower clusters, as one lower red cluster would still be on the opposite side of the blue class from the other lower red cluster.

You need a more complex model. As @Dave notes in a comment on another answer, a $x_1^2$ term might well help, providing a way to distinguish the 2 lower red clusters from the blue cluster. You might also consider approaches other than logistic regression. For example ISLR in Chapter 9 shows how choices of kernels in support vector machines can help distinguish classes that have non-linear boundaries, as yours do in this plot.

$\endgroup$
2
  • $\begingroup$ Thank you for your nice answer. From your response, I got this impression that if classes 1 and 2 were distributed linearly in $x_1$ and $x_2$ space, then logistic regression would able to distinguish them, and that would be the result of linear relationship $\theta_1 x_1+\theta_2 x_2 +\theta_0$ there? $\endgroup$
    – Raz
    Commented Jul 16, 2020 at 20:15
  • 1
    $\begingroup$ @Raz yes, a linear regression works when the log-odds of outcome is related to a linear predictor of some form. If the form you note in the comment explains the data adequately, then fine. For the data that you show, an extra term of $\theta_3 x_1^2$ might help better to estimate the probabilities of class membership and ultimately, say, to assist in class assignments of new cases based on those probability estimates. $\endgroup$
    – EdM
    Commented Jul 17, 2020 at 16:03
2
$\begingroup$

why logistic regression classifies them wrongly and at least does not involve one of the small clusters?

The center clusters (red and blue) have a wide spread on x2.

Adding regularization will also be better.

How should I rearrange the red clusters to reduce the misclassification?

This means we can change our data to make the performance better. I think this is cheating in real world. But for learning purposes, it is a perfect question.

My answer is if we move one of the small red clusters higher (say, make the red cluster on right side to be centered around 0,0.25), it will definitely fix the problem.

$\endgroup$
4
  • $\begingroup$ Indeed, it's a synthetic data, and I am learning from the process, my main question is that how data can influence the decision boundary? Because what I expected is to have just one small red cluster as misclassification, not both small clusters. $\endgroup$
    – Raz
    Commented Jul 16, 2020 at 12:48
  • $\begingroup$ It would be cheating to add an $x_1^2$ term? $\endgroup$
    – Dave
    Commented Jul 16, 2020 at 13:32
  • $\begingroup$ you mean, nonlinear logistic regression? $\endgroup$
    – Raz
    Commented Jul 16, 2020 at 20:16
  • 3
    $\begingroup$ @Raz the $x_1^2$ term does not make this a nonlinear logistic regression. The linearity in ordinary least squares or in generalized linear models like logistic regression is linearity in the coefficients. So if you add a term $\theta_3 x_1^2$ to your model you still have a model linear in the coefficients $\theta_i$. This is a common confusion in terminology. $\endgroup$
    – EdM
    Commented Jul 17, 2020 at 16:06
1
$\begingroup$

I realise this is a little late to the party, but I just had a similar issue with a logistic regression model of my own and wanted to understand why it wasn't at least orienting the decision plane to include more data-points and/or basing the minimum misclassification boundary more favourably. I was using iterated reweighted least squares fitting (Rubin, 1983) but where I had implemented this myself.

For me, I was getting very similar results to Raz (with a different arrangement of data-points). Namely, the decision plane didn't seem best oriented and the minimum misclassification boundary (at posterior probability 0.5) wasn't in the best position (I could change the threshold at which I drew the boundary and improve the accuracy). These strange characteristics seemed to arise because I had forgotten to include a bias term in my model (or a constant bias column in my data). Adding this in I began to see the anticipated results.

If anyone sees this behaviour themselves, I suggest you check to see that your bias term is properly included.

References

D. B. Rubin, Iteratively Reweighted Least Squares , Encycl. Stat. Sci. 33 (1983), 7–17.
$\endgroup$

Your Answer

By clicking “Post Your Answer”, you agree to our terms of service and acknowledge you have read our privacy policy.

Not the answer you're looking for? Browse other questions tagged or ask your own question.