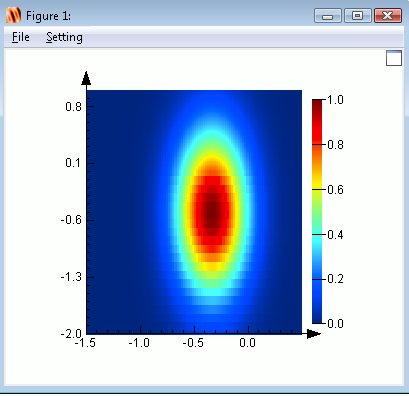
I have a 2-D probability distribution along the lines of this plot:
I know how to find the confidence interval for a 1-D probability distribution (by the definition of standard deviation or the 68-95-99 rule) but I don't know how to generalize that to 2-D to get a confidence region.
I've been looking at Principle Component Analysis and covariance matrices, but most explanations or examples are for a 2D distribution of random vectors rather than a probability distribution so I'm not quite sure how to generalize it.
How would I find the 1-$\sigma$/2-$\sigma$ regions for a 2D probability distribution?
Edit: The question that was linked in the duplicate message refers to random vectors, whereas what I have is a probability distribution from data, with a continuous 2-D probability function as opposed to random vectors. As such, I cannot find the covariance matrix between two vectors because I DO NOT HAVE TWO VECTORS, and therefore cannot apply the process described in the linked question.
If I were to analogize to 1-D, my issue is the difference between the standard deviation for a random distribution of samples, $\sigma=\sqrt{\frac{1}{N}\sum (x_{i}-\bar{x})^{2}}$, and the standard deviation for a probability distribution $\sigma=\sqrt{\sum (x_{i}-\bar{x})^{2}P(x_{i})}$. As far as I can tell, the method involving the covariance matrix is a generalization of the former. I need a generalization of the latter.
If I'm wrong in my understanding, please let me know, but I don't think the other question gives me what I need.

