0
$\begingroup$

I am training a network ESNet in Pytorch to predict vanishing point as per VPGNet ICCV 2017 paper. I am using SGD with 0.1 learning rate and ReducedLR scheduler with patience = 5.

My loss curve is something like this which I am not able to interpret.enter image description here
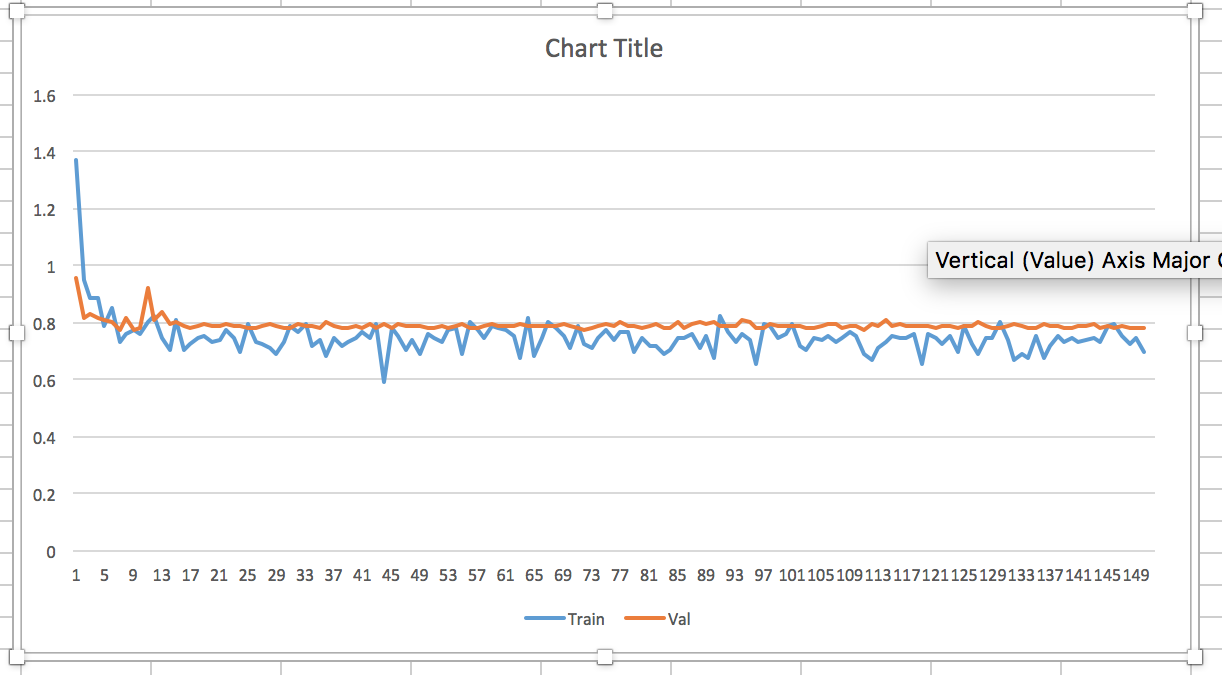
Any idea what is happening?

Visually the network predicts nearly the same point in almost all the validation images.

PS: Y axis is loss and X is the epoch. The network is trained for 150 epochs.

$\endgroup$
2
  • $\begingroup$ Could you explain what the axes are? I assume $y$ axis is value of loss function but $x = ?$ $\endgroup$
    – jcken
    Commented Sep 30, 2020 at 7:21
  • $\begingroup$ Yeah sorry, Y is loss and X is epoch $\endgroup$ Commented Sep 30, 2020 at 7:22

1 Answer 1

1
$\begingroup$

Visually the network predicts nearly the same point in almost all the validation images.

Unless your validation set is full of very similar images, this is a sign of underfitting. Also the stability in the validation loss from the start indicates that the network not learning. There are fluctuations in the training curve, but I'd say they are more or less around the same values. Interestingly there are larger fluctuations in the training loss, but the problem with underfitting is more pressing.

Plotting the learning rate by epochs would be useful to see the effect of patience hyperparameter.

$\endgroup$

Your Answer

By clicking “Post Your Answer”, you agree to our terms of service and acknowledge you have read our privacy policy.

Not the answer you're looking for? Browse other questions tagged or ask your own question.