0
$\begingroup$

I'm running a DNN on a dataset in order to predict the output values (y). The actual vs fitted graph shows a slight overestimation of the small values and an underestimation of the higher values. enter image description here
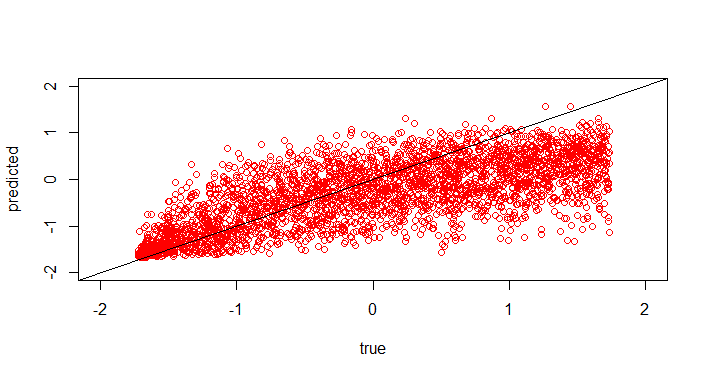
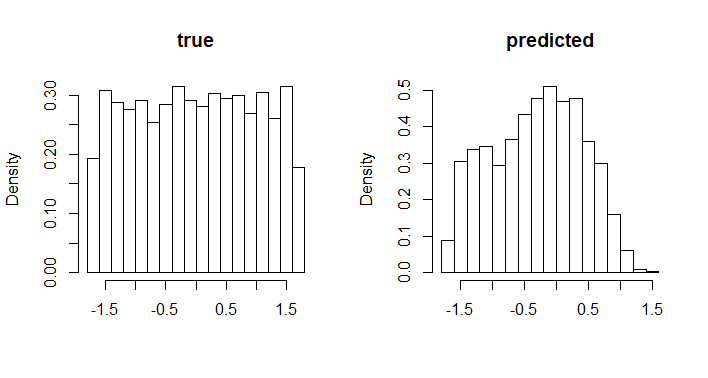
The activation function I used in each layer is the Relu function and the Loss is a simple MSE. I tried to compare the distributions of the actual values and the fitted. enter image description here
My questions are:

  1. What can i deduce from the second plot that i don't already know from the first?
  2. In order to gain a better fit i was thinking of assigning a weight to the high y values in the training set or duplicating them. But isn't this method "cheating"?
$\endgroup$
3
  • $\begingroup$ How do you know your features are informative? $\endgroup$
    – Sycorax
    Commented Oct 19, 2020 at 11:27
  • $\begingroup$ @Sycorax The only available features i have are measurements coming from a segmented 3D cube. Basically every feature is a different x,y,z coordinate, each one containing a real value for every different observation. Is there a way to check if this kind of features are informative? $\endgroup$
    – Demi
    Commented Oct 19, 2020 at 13:49
  • $\begingroup$ Related $\endgroup$
    – Dave
    Commented Mar 7, 2023 at 18:22

0

Your Answer

By clicking “Post Your Answer”, you agree to our terms of service and acknowledge you have read our privacy policy.