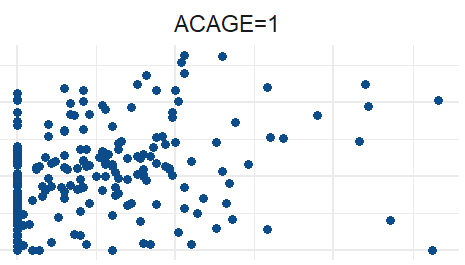
Is it still of utility to run a full-blown LME modelling procedure when the visual inspections between the predictors and outcome variable are characterless?
I have been arguing that it makes little sense to invest more time and effort in using LME in such a case, since the goal is to discover which predictors have significant effects on the outcome but visually eyeballing the pairwise scatter plots indicates otherwise.
In greater detail, I have two predictors W and G and an outcome S2 in a longitudinal dataset; the time variable is called ACAGE, which is the individuals' ages. I am interested to see whether any of the two predictors influence S2 significantly.
I produced the scatter plots of mean S2 over ACAGE against W of individuals. In addition, instead of averaging S2 over ACAGE, I faceted by ACAGE in a second group of plots. I did the same also for G. Here is an example where S2 values constitute the y-axis and W the x-axis (I cannot show too much due to data privacy):
None of the plots showed patterns/candidate relationships between the independent and dependent variables. I am wondering whether it is wise to proceed to LME in this case, and I think it is not.
Notes:
- I have 484 subjects and 9 items
- The subjects and items are crossed, not nested
- The "best" model itself is still unspecified, but it is along the lines of
S2 ~ G * W + (G*W | subject_id) + (G*W | item_id)


S ~ G * W + (G*W | subject_id) + (G*W | item_id). I hope this answers your question. $\endgroup$ACAGEin the formula ? $\endgroup$