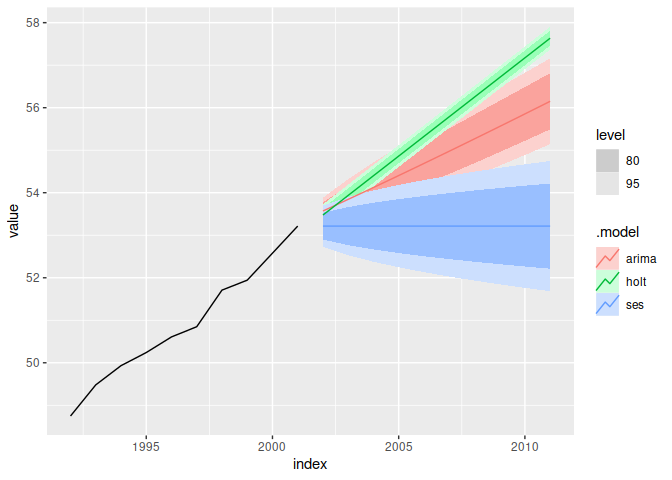
I have hierarchical data that I want to forecast, reconcile, and then plot each model's forecast.
UPDATE: In my attempt to make a minimum reproducible example I made it too simple and didnt really ask the question I'm trying to ask. I changed the modeling function from auto.arima to a custom function that goes through a number of models. The reason for this is I dont just want to model / plot the best fit model but a number of them. Not shown here is that auto.arima is actually used in the modeling function to get the few best arima models. So in summary I want to model and plot a number of hierarchical series using a number of models and I want to be able to visualize them and their prediction intervals individually after reconciliation.
Using the example in the function vignette I can forecast each series in the hierarchy and plot it like this:
library(forecast)
library(hts)
h <- 10
ally <- aggts(htseg1)
## changed this from allf to three different tables showing I need to
## be able to check different models, not just the best fit.
allf_single <- matrix(NA, nrow=h, ncol=ncol(ally))
allf_dub_add <- matrix(NA, nrow=h, ncol=ncol(ally))
allf_dub_add_damp <- matrix(NA, nrow=h, ncol=ncol(ally))
all_mod <- list()

## Adding custom function to show I need to look at multiple models per
## series.
mod_func <- function(time_series, h) {
  single_es <- ses(time_series, h=h)
  double_es_add <- holt(time_series, damped=FALSE, exponential=FALSE, h=h)
  double_es_add_damp <- holt(time_series, damped=TRUE, exponential=FALSE, h=h)

  model_list <- list(single=single_es,
                          double_add=double_es_add,
                          double_add_damp=double_es_add_damp)
  return(model_list)
}

#forecast each series
for(i in 1:ncol(ally)) {
  series <- colnames(ally)[i]
  ## changed this from auto.arima to custom function
  all_mod[[series]] <- mod_func(ally[ , i], h=h)
  ## capturing predictions for each model and each series
  ## (only single shown here)
  allf_single[ , i] <- all_mod[[series]][["single"]]$mean
  allf_dub_add[ , i] <- all_mod[[series]][["double_add"]]$mean
  allf_dub_add_damp[ , i] <- all_mod[[series]][["double_add_damp"]]$mean
}

#plot multiple models for single series
autoplot(all_mod[["Total"]][["single"]])
autoplot(all_mod[["Total"]][["double_add"]])
autoplot(all_mod[["Total"]][["double_add_damp"]])
I can then reconcile the hierarchy, substitute in the new forecast values, and plot an individual series like this:
#reconcile the hierarchy
allf_dub_add_damp <- ts(allf_dub_add_damp, start=51)
y.f <- combinef(allf_dub_add_damp, get_nodes(htseg1), keep="all", algorithms="lu")

#replace forecast values with reconciled values
for(i in 1:length(all_mod[["Total"]][["double_add_damp"]][["mean"]])) {
  all_mod[["Total"]][["double_add_damp"]][["mean"]][i] <- y.f[ , 1][i]
}

#plot single reconciled series
autoplot(all_mod[["Total"]][["double_add_damp"]])
Where I'm stuck is how to adjust the confidence interval of the model post reconciliation. I know if I can calculate the confidence interval I can substitute it into the forecast model object in the upper and lower slots like the forecast values, but I'm not sure how to calculate the confidence interval after reconciliation. The only thing I have found that seems relevant to this question is this post, but there is no answer to the question.
Any help would be greatly appreciated!

