18
$\begingroup$

[Hoping that this is the right Stackexchange site; inspired from a true story seen at work]

Joe has a measuring instrument and $n$ objects to be measured (say, a scale and $n$ weights). He measures each one, obtaining a list of measurements $X=\left[x_1 \dots,x_n\right] \in\mathbb R^n$.

Later on, he sends me the objects. I want to find the correspondence between each object and its respective measured value $x_i$, but Joe forgot to number the objects or to sort them in any way that allows me to find which one is the $i$-th object. I therefore measure them again with a similar instrument, obtaining a list of values $Y=\left[y_1 \dots,y_n\right] \in\mathbb R^n$.

If our instruments were perfectly accurate, then $Y$ would be a permutation of $X$. However, our instruments are not perfect; while they both have perfect trueness, they have imperfect precision. In other words, if we measure the same object many times, the average value of the repeated measurements tends to the true value, but the results have (known) standard deviations $\sigma_J$ and $\sigma_I$ (for Joe's instrument and for mine, respectively). Therefore, the values in $X$ will in general be different from the values in $Y$.

In the limiting case where all values are distinct from each other (that is, $\displaystyle\min_{x_i,x_j\in X}\{|x_i-x_j|\}\gg\sigma_J$ and similarly $\displaystyle\min_{y_i,y_j\in Y}\{|y_i-y_j|\}\gg\sigma_I$), finding the correct permutation (that is, the correspondence between a value in $X$ and the corresponding value in $Y$) is trivial. When this is not the case, however, how would one go to find the most likely permutation from $X$ to $Y$ from the data available?

Bonus questions: does the answer change if I no longer assume perfect trueness? Is the case $\sigma_J=\sigma_I$ easier?

EDIT Forgot to ask: how do I compute the probability of a given permutation, that is, the probability that it is the correct one among the space of $n!$ possible permutations? Is there a simple (preferably closed-form) expression for the probability of the optimal permutation (which appears to be the one corresponding to sorting both vectors, see whuber's solution below - at least if the errors are normally distributed)?

EDIT 2 Per Aksakal observation (see comments to the question): assume that all true weights are strictly distinct (the measurements, both for me and for Joe, can be non-distinct values due to measurement error).

$\endgroup$
15
  • 7
    $\begingroup$ +1 For the record, "trueness" is usually termed "accuracy." As to your question: the obvious solution is to compute the likelihood of every permutation and select a permutation having the largest likelihood. This can take some time, since there are $n!$ permutations to examine. By the phrase "how would one go to find" are you perhaps trying to ask whether there is an efficient algorithm? (I believe there is: make the measurements correspond in rank order. That's a $O(n\log(n))$ algorithm) $\endgroup$
    – whuber
    Commented Jan 12, 2021 at 21:27
  • 3
    $\begingroup$ If the measurement error isn't normally distributed, just sorting might not give the best answer. For example, suppose that the error distribution is fat-tailed so that there are occasionally huge errors. Then if Joe measures 1,52,53,54,55 and you measure 52,53,54,55,100 then Joe's 1 most likely corresponds to your 100. $\endgroup$
    – fblundun
    Commented Jan 12, 2021 at 22:56
  • 1
    $\begingroup$ here's a conjecture: sorting doesn't work only in presence of dependence between measurements. prove it $\endgroup$
    – Aksakal
    Commented Jan 13, 2021 at 1:24
  • 1
    $\begingroup$ @Aksakal Well, then for a given fat-tailed error distribution a method that computes the likelihood of every permutation by brute-force, and returns the one with best likelihood, gives better results than sorting. It cannot be worse than sorting on any dataset, and it's sometimes better, such as in fblundun's example. $\endgroup$
    – JiK
    Commented Jan 14, 2021 at 22:24
  • 1
    $\begingroup$ @Aksakal I don't think sorting would work in those cases either? $\endgroup$
    – JiK
    Commented Jan 14, 2021 at 22:28

3 Answers 3

16
$\begingroup$

Provided the measurement errors are independent and identically Normally distributed for each instrument, the solution is to match the two sets of measurements in sorted order. Although this is intuitively obvious (comments posted shortly after the question was posted state this solution), it remains to prove it.

To this end, let the first set of measurements in sorted order be $x_1\le x_2\le \cdots \le x_n$ and let the second set of measurements in sorted order be $y_1\le y_2\le \cdots \le y_n.$ Let the error distributions have zero means and variances $\sigma^2$ for the X instrument and $\tau^2$ for the Y instrument. (I find this notation a little more congenial than the subscripting in the question.)

To find the most likely permutation, we solve the maximum likelihood problem. Its parameters are (a) the $n$ true weights $\theta_i$ corresponding to the objects measured by each $x_i$ and (b) the permutation $s$ that makes $y_{s(i)}$ the second measurement of object $i.$ Insofar as the likelihood depends on $(\theta)$ and $s,$ the likelihood of these observations is proportional to the exponential of

$$\mathcal{L}(\theta,s) = -\frac{1}{2}\sum_{i=1}^n \left(\frac{x_i-\theta_i}{\sigma}\right)^2 + \left(\frac{y_{s(i)}-\theta_i}{\tau}\right)^2.$$

For any given $s,$ this expression (and therefore its exponential) is maximized term by term by taking

$$\hat\theta_i = \frac{\tau^2 x_i + \sigma^2 y_{s(i)}}{\sigma^2 + \tau^2}.$$

For these optimal values of $\theta,$ the value of $-2\mathcal{L}$ (which we wish to minimize) is

$$-2\mathcal{L}(\hat\theta,s) = \frac{1}{\sigma^2+\tau^2}\sum_{i=1}^n \left(x_i - y_{s(i)}\right)^2.$$

When each squared expression is expanded we obtain (a) a sum of the $x_i^2,$ (b) a sum of the $y_{s(i)}^2$ (which equals the sum of the $y_i^2$ because $s$ is a permutation), and (c) the cross terms,

$$-2\sum_{i=1}^n x_i y_{s(i)}.$$

The Rearrangement Inequality states that such sums of products are maximized (thereby maximizing $\mathcal{L}(\hat\theta, s)$) when the $y_{s(i)}$ are in increasing order, QED.


This analysis relies on the Normality assumption. Although it can be relaxed, some distributional assumption is needed, as @fblundun perceptively points out in a comment to the question.

$\endgroup$
5
$\begingroup$

@whuber (+1) has answered the question in your title about finding the most likely permutation. My purpose here is to explore briefly by simulation whether you can expect that most likely permutation to be exactly correct. Roughly speaking, the order for the second weighing is most likely to be correct if the minimum difference in weights of the objects is larger than $3\sigma,$ where $\sigma$ is the standard deviation of the the balance used to do the weighing.

Let's say there are $n = 6$ objects with true weights $\mu = 10, 20, 30, 40, 50, 60$ measured initially on a balance with $\sigma=1.$ Then weights might be as shown in the vector x below. [Sampling and computations in R.]

set.seed(112)
n = 6; mu = c(10,20,30,40,50,60)
x = numeric(n)
for(i in 1:n) { x[i] = rnorm(1, mu[i], 1) }
x
[1]  9.685768 22.403375 29.281736 38.239389 48.874719 59.280459

Because smallest differences (10) in true weights are considerably greater than $\sigma=1$ we can expect that a second weighing, will put them into the same order as in y.

set.seed(113)
n = 6; mu = c(10,20,30,40,50,60)
y = numeric(n)
for(i in 1:n) { y[i] = rnorm(1, mu[i], 1) }
y
[1] 10.13335 21.37522 30.74872 38.70615 49.44123 58.26755

Thus the ranks of all six objects in the two weighings agree:

sum(rank(x)==rank(y))
[1] 6

However, if the differences among the true weights are not several $\sigma$s apart, then the ranks may be scrambled. (Below, again with gaps of 10, but $\sigma=4,$ specimens 2 and 3 are not consistent.)

set.seed(112)
n = 6; mu = c(10,20,30,40,50,60)
x = numeric(n)
for(i in 1:n) { x[i] = rnorm(1, mu[i], 4) }
x
[1]  8.743073 29.613500 27.126944 32.957556 45.498875 57.121838

set.seed(113)
n = 6; mu = c(10,20,30,40,50,60)
y = numeric(n)
for(i in 1:n) { y[i] = rnorm(1, mu[i], 4) }
y
[1] 10.53342 25.50089 32.99486 34.82460 47.76492 53.07020

sum(rank(x)==rank(y))
[1] 4

So, in order to know how good the best permutation might be, you would need to take into account the diversity of the object weights and the precision of the balance.

$\endgroup$
10
  • 1
    $\begingroup$ What justifies the conclusion beginning at "So, ..."? $\endgroup$
    – whuber
    Commented Jan 12, 2021 at 22:58
  • $\begingroup$ Seems to me anytime the smallest difference in item weights is smaller than about $3\sigma,$ the chance of an inversion is no longer negligible. Am I wrong about that? $\endgroup$
    – BruceET
    Commented Jan 12, 2021 at 23:01
  • 4
    $\begingroup$ @whuber this answer by BruceET is consistent with your answer. The most likely permutation is equality $rank(x) = rank(y)$. For any particular outcome in which $rank(x) \neq rank(y)$ the probability will be smaller. However, you can categorize these outcomes (e.g. the average distance from the original rank), and the most likely distance might not necessarily need to be zero because several permutations might relate to each class (each of them individually having a lower probability but together as a class having a larger probability). $\endgroup$ Commented Jan 13, 2021 at 15:45
  • 1
    $\begingroup$ @whuber in addition, you solved a maximum likelihood problem "for which permutation is the given observation the most likely". That is a different question from: "which permutation is the most probable outcome" (which seems to be answered with a simulation like BruceET's). Although for the normal distribution I suspect that it does not matter. $\endgroup$ Commented Jan 13, 2021 at 15:48
  • 2
    $\begingroup$ @whuber I agree that identity is the most likely permutation (and most likely is what the OP asked for). But I imagine that for some distribution other than Gaussian it might be possible that the permutation with the highest probability might not need to be identity. $\endgroup$ Commented Jan 13, 2021 at 15:53
2
$\begingroup$

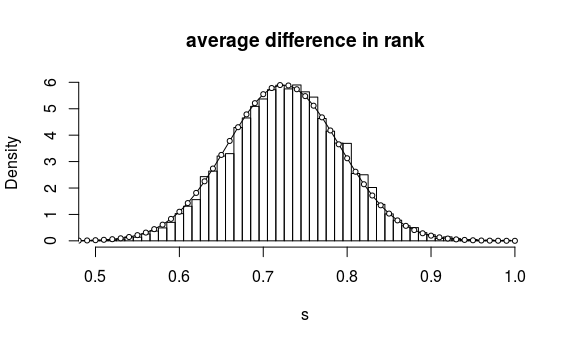
Inspired by BruceET's answer here is a simulation that computes the distribution of the difference in the rank. While Whuber's answer shows that identity is the most likely permutation, it is not the most likely difference in rank (there is only one permutation, the identity, with no change in rank, but there are many permutations with the same difference in rank and these add up together).

The simulation uses some random distribution of the true weights (with the line mu <- c(1:n)*d they are evenly distributed)

original weights

The histogram can be approximated with a Poisson-binomial distribution which itself can be approximated with a Gaussian distribution. The image below shows a comparison for the simulation (the histogram) and the approximation (the line with points).

comparison

### settings
set.seed(1)
n <- 200
d <- 2
sig <- 1
mu <- runif(n,0,d*n) 
mu <- mu[order(mu)]
#mu <- c(1:n)*d

### simulation of drawing X and Y
### the output is the average difference in rank
simulate <- function(n,d,sig,mu) {
  x <- rnorm(n,mu,sig)
  y <- rnorm(n,mu,sig)
  return(mean(abs(rank(x)-rank(y))))
}

### perform the simulation 10 000 times and plot historgram
s <- replicate(10^4, simulate(n,d,sig,mu))
hist(s, breaks = seq(-1/n,max(s)+1/n,2/n), freq = 0,
     main = "average difference in rank",
     xlim = c(0.5,1))

### compute probabilities that ranks get swapped 1 or 2 places
###    the 2*p*(1-p) relates to the probability that 
###    the swap occurs in X but not in Y or vice versa
p <- 1-pnorm(mu[-1]-mu[-n],0,sig*sqrt(2))
p <- 2*p*(1-p)
p2 <- 1-pnorm(mu[-c(1:2)]-mu[-c(n-1,n)],0,sig*sqrt(2))
p2 <- 2*p2*(1-p2)

### normal approximation of the Poisson-binomial
dvar <- sum(p*(1-p))+sum(p2*(1-p2))
dmu <- sum(p)+sum(p2)

### plotting
ds <- 0:100
lines(ds*(2/n), dnorm(ds,dmu,sqrt(dvar))*(n/2))
points(ds*(2/n), dnorm(ds,dmu,sqrt(dvar))*(n/2), pch = 21 , col = 1, bg = 0, cex = 0.7)
$\endgroup$

Your Answer

By clicking “Post Your Answer”, you agree to our terms of service and acknowledge you have read our privacy policy.

Not the answer you're looking for? Browse other questions tagged or ask your own question.