I am currently working with the Brandsma data of the mice package in R for teaching purposes.
The dataset is from Snijders&Bosker(2012), or rather Brandsma&Knuver(1989) and Knuver&Brandsma(1993), containing data from 4106 pupils attending 216 schools in the Netherlands:
Snijders, T. A. & Bosker, R. J. (2011). Multilevel analysis: An
introduction to basic and ad-vanced multilevel modeling. Sage.Brandsma, H. P., & Knuver, J. W. M. (1989). Effects of school and classroom characteristics on pupil progress in language and arithmetic. International Journal of Educational Research, 13(7), 777-788.
Knuver, A. W., & Brandsma, H. P. (1993). Cognitive and affective
outcomes in school effec-tiveness research. School effectiveness and school improvement, 4(3), 189-204.
There are several variables that are giving test results at the beginning and at the end of the observation period (lpr, apr, lpo and apo).
However, I do not quite understand what the theoretical range of these test scores is and I do not find any explanation on this in the according references.
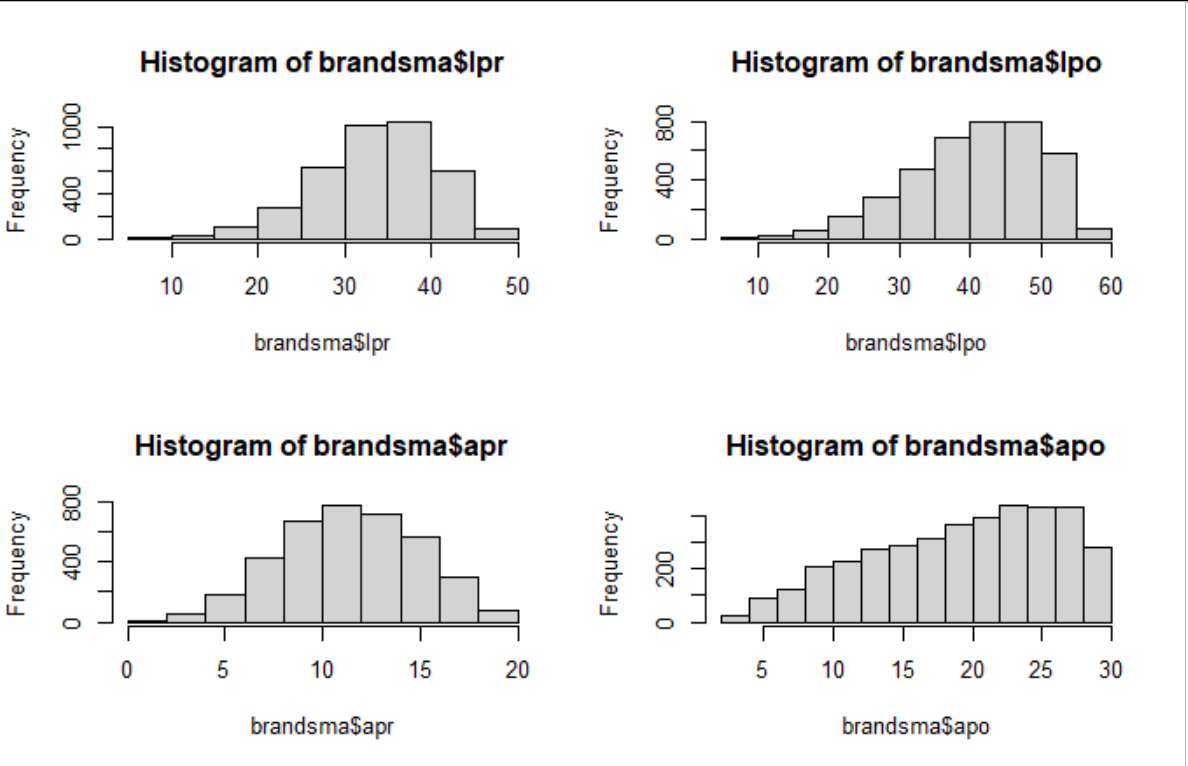
I have read so far that in the Netherlands scores can range from 1 to 10 with 1 being the lowest, 10 the highest and 4 unsatisfactory (not passed). However, the distribution of the variables looks like this:
So I am currently understanding the values as percentage, e.g. if the student got a 5.5 the grade will be 55%.
If this is true, most or even all of the students have failed the according test.
Could anyone who knows a bit more about the Dutch grading system or the Brandsma data or who has a better understanding of how the data might have been collected/manipulated explain how it ends up with this distribution?

