28
$\begingroup$

Suppose that two groups, comprising $n_1$ and $n_2$ each rank a set of 25 items from most to least important. What are the best ways to compare these rankings?

Clearly, it is possible to do 25 Mann-Whitney U tests, but this would result in 25 test results to interpret, which may be too much (and, in strict use, brings up questions of multiple comparisons). It is also not completely clear to me that the ranks satisfy all the assumptions of this test.

I would also be interested in pointers to literature on rating vs. ranking.

Some context: These 25 items all relate to education and the two groups are different types of educators. Both groups are small.

EDIT in response to @ttnphns:

I did not mean to compare the total rank of items in group 1 to group 2 - that would be a constant, as @ttnphns points out. But the rankings in group 1 and group 2 will differ; that is, group 1 may rank item 1 higher than group 2 does.

I could compare them, item by item, getting mean or median rank of each item and doing 25 tests, but i wondered if there was some better way to do this.

$\endgroup$
13
  • 1
    $\begingroup$ If each person ranked 25 items than the sum across the 25 variables is a constant (325). Given that, what do you mean saying the best ways to compare these rankings - what type of difference bw the 2 groups would you like to know? $\endgroup$
    – ttnphns
    Commented Mar 4, 2013 at 16:36
  • 2
    $\begingroup$ Maybe to compute Kemeny's Median for each group? I haven't done it myself and don't know if the 2 results could be than compared statistically (i.e. with inference to population). $\endgroup$
    – ttnphns
    Commented Mar 4, 2013 at 17:07
  • 1
    $\begingroup$ Another option might be repeated measures ordinal regression (where the interaction bw the group factor and the rm factor will be your interes); this can be done via GEE model with multinomial distribution and logit link. But, again, because the sum across 25 items is a constant, I can't say now if it is mathematically valid. $\endgroup$
    – ttnphns
    Commented Mar 4, 2013 at 17:14
  • 2
    $\begingroup$ I don't have the book on me, but "Measurement Theory and Practice" by D Hand discusses some issues that sound similar to this. What in particular do you want to know about the "difference" in ranking. For example, could you not first create an aggregate ranking for each group, and then take the rank correlation? $\endgroup$
    – Corvus
    Commented Mar 4, 2013 at 17:43
  • 2
    $\begingroup$ @PeterFlom Have you finally found a solution for the rank comparison? If yes, would you mind to post it? :) $\endgroup$ Commented Jul 31, 2016 at 11:33

4 Answers 4

12
+100
$\begingroup$

Summary

I share my thoughts in Details section. I think they are useful in identifying what we really want to achieve.

I think that the main problem here is that you haven't defined what a rank similarity means. Therefore, no one knows which method of measuring the difference between the ranks is better.

Effectively, this leaves us to ambiguously choose a method based on guesses.

What I really suggest is to first define a mathematical optimization objective. Only then we will be sure whether we really know what we want.

Unless we do that, really don't know what we want. We might almost know what we want, but almost knowing $\ne$ knowing.

My text in Details essentially is a step towards reaching a mathematical definition of ranks similarity. Once we nail this, we can confidently move forward to choose the best method of measuring such similarity.

Details

Based on one of yur comments:

  • "The objective is to see if the two groups rankings differ", Peter Flom.

To answer this while strictly interpreting the objective:

  • The ranks are different if, any item $i \in \{1,2,\ldots,25\}$, there exists $i$ such that $a_i \ne b_i$, where $a_i$ is the rank of of item $i$ by group $a$ and $b_i$ is the rank of the same item but by group $b$.
  • Else, the ranks are not different.

But I don't think that you really want that strict interpretation. Therefore, I think what you really meant to say is:

  • How different are the ranks of groups $a$ and $b$?

One solution here is simply to measure the minimum edit distance. I.e. what are the minimum number of edits that need to be performed on the ranked list of group $a$ such that it becomes identical to that of group $b$.

An edit could be defined as swapping two items, and costs costs $n$ points depending how many hops are needed. So if item $1$ needs to be swapped with item $3$ (in order to achieve identical ranks between those of groups $a$ and $b$), then the cost for this edit is $3$.

But is this method suitable? To answer this, let's look at it a bit deeper:

  • It's not normalized. If we say that the distance between ranks of groups $a,b$ is $3$, while the distance between the ranks of groups $c,d$ is $123$, it doesn't necessarily mean that $a,b$ are more similar each other than $c,d$ are to each other (it could also possibly mean that $c,d$ were ranking a much larger set of items).

  • It assumes that the cost of each edit is linear with respect to number of hops. Is this true for our application domain? Could it be that a logistic relationship is more suitable? Or an exponential one?

  • It assumes that all items are equally important. E.g. disagreement in ranking item (say) $1$ is treated identically to the disagreement in ranking item (say) $5$. Is this true in your domain? For example, if we are ranking books, is disagreeing on ranking of a famous book such as a TAOCP one, equally important to disagreeing on the ranking of a terrible book such as TAOUP?

Once we address the points above, and reach a suitable measure of similarity between two ranks, we will then need to ask more interesting questions, such as:

  • What is the probability of observing such differences, or more extreme differences, if the difference between the groups $a$ and $b$ was only due to random chance?
$\endgroup$
2
  • $\begingroup$ I was getting so excited reading through this answer only to be left wanting more! $\endgroup$
    – bdeonovic
    Commented Feb 5, 2021 at 20:53
  • $\begingroup$ Thanks. What's next is heavily domain-specific. E.g. a for-profit library's objective might be to find the ranking system that maximises its revenue. However, in my view, there is an asymptotically true fundamental optimisation objective that guides everything, which is: survival maximisation of life forms. Some disagree with this, and I think they underrate it due to its deceptive simplicity, but I think those who disagree with it are due to the randomness of evolution, and the asymptotic pattern is agreement with it. I.e. only life-form surviving ranking algorithm will survive. $\endgroup$
    – caveman
    Commented Feb 23, 2021 at 11:13
7
$\begingroup$

Warning: it's a great question and I don't know the answer, so this is really more of a "what I would do if I had to":

In this problem there are lots of degrees of freedom and lots of comparisons one can do, but with limited data it's really a matter of aggregating data efficiently. If you don't know what test to run, you can always "invent" one using permutations:

First we define two functions:

  • Voting function: how to score the rankings so we can combine all the rankings of a single group. For example, you could assign 1 point to the top ranked item, and 0 to all others. You'd be losing a lot of information though, so maybe it's better to use something like: top ranked item gets 1 point, second ranked 2 points, etc.

  • Comparison function: How to compare two aggregated scores between two groups. Since both will be a vector, taking a suitable norm of the difference would work.

Now do the following:

  1. First compute a test statistic by computing the average score using the voting function for each item across the two groups, this should lead to two vectors of size 25.
  2. Then compare the two outcomes using the comparison function, this will be your test statistic.

The problem is that we don't know the distribution of the test statistic under the null that both groups are the same. But if they are the same, we could randomly shuffle observations between groups.

Thus, we can combine the data of two groups, shuffle/permute them, pick the first $n_1$ (number of observations in original group A) observations for group A and the rest for group B. Now compute the test statistic for this sample using the preceding two steps.

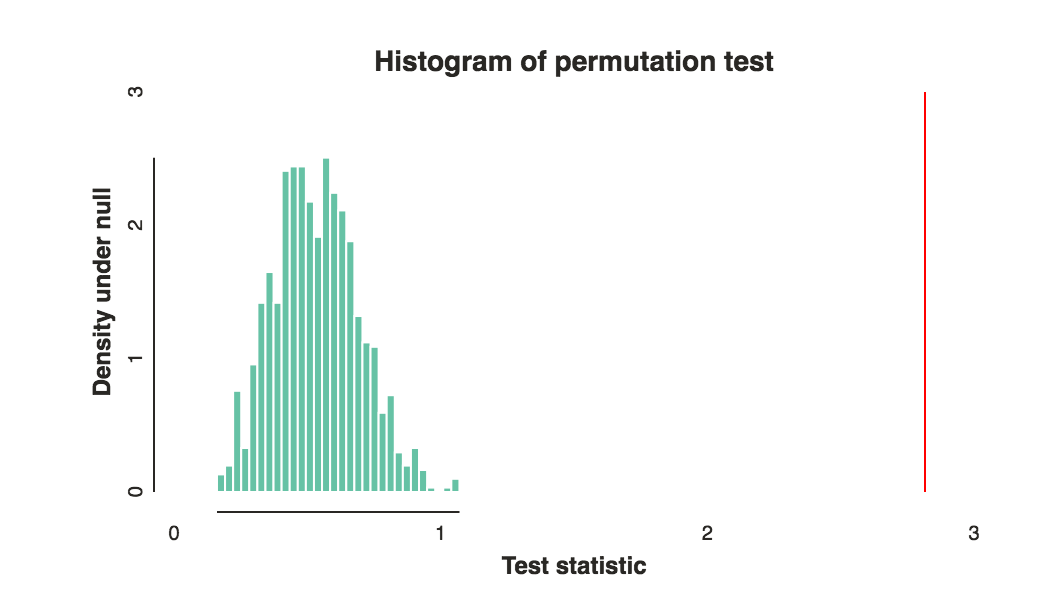
Repeat the process around 1000 times, and now use the permutation test statistics as empirical null distribution. This will allow you to compute a p-value, and don't forget to make a nice histogram and draw a line for your test statistic like so:

histogram permutation test l1

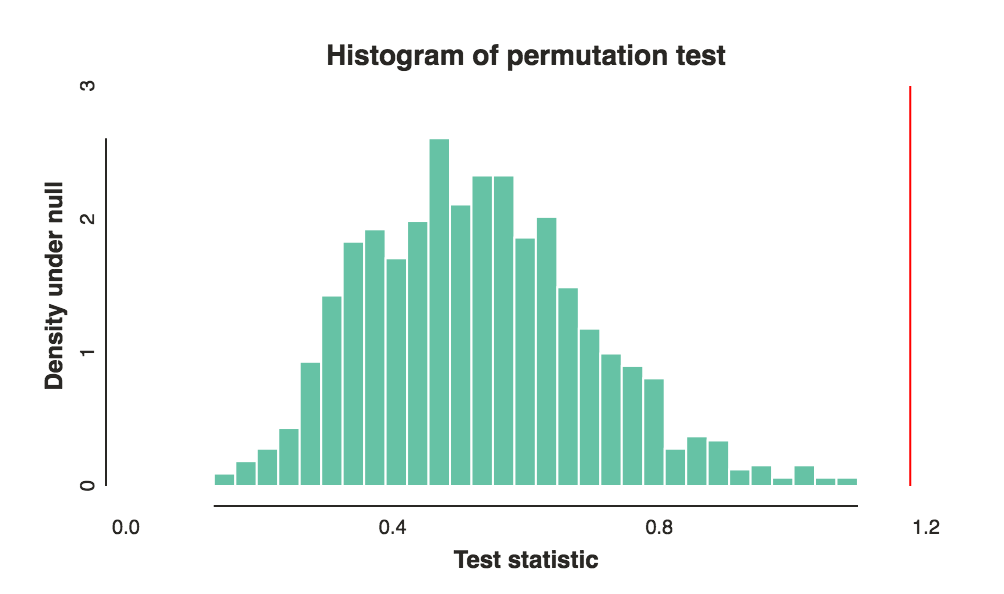
Now of course it is all about choosing the right voting and comparison functions to get good power. That really depends on your goal and intuition, but I think my second suggestion for voting function and the $l_1$ norm are good places to start. Note that these choices can and do make a big difference. The above plot was using the $l_1$ norm and this is the same data with an $l_2$ norm:

histogram permutation test l2

But depending on the setting, I expect there can be a lot of intrinsic randomness and you'll need a fairly large sample size to have a catch-all method work. If you have prior knowledge about specific things you think might be different between the two groups (say specific items), then use that to tailor your two functions. (Of course, the usual do this before you run the test and don't cherry-pick designs till you get something significant applies)

PS shoot me a message if you are interested in my (messy) code. It's a bit too long to add here but I'd be happy to upload it.

$\endgroup$
1
  • $\begingroup$ I really like this idea. $\endgroup$
    – Peter Flom
    Commented Aug 2, 2016 at 11:22
5
$\begingroup$

This sounds like the 'Willcoxon signed-rank test' (wikipedia link). Assuming that the values of your ranks are from the same set (ie [1, 25]) then this is a paired-difference test (with the null-hypothesis being these pairs were picked randomly). NB this is a dis-similarity score!

There are both R and Python implementations linked to in that wiki page.

$\endgroup$
1
  • $\begingroup$ Interesting. I hadn't heard of a paired difference Wilcoxon. $\endgroup$
    – Peter Flom
    Commented Aug 1, 2016 at 23:02
3
$\begingroup$

In "Sequential rank agreement methods for comparison of ranked lists" Ekstrøm et al. discuss this in detail (including a survey of existing techniques circa 2015) while introducing a new measure called "sequential rank agreement". It's available on arxiv at: https://arxiv.org/pdf/1508.06803.pdf. The abstract says it better than I could:

The comparison of alternative rankings of a set of items is a general and prominent task in applied statistics. Predictor variables are ranked according to magnitude of association with an outcome, prediction models rank subjects according to the personalized risk of an event, and genetic studies rank genes according to their difference in gene expression levels. This article constructs measures of the agreement of two or more ordered lists. We use the standard deviation of the ranks to define a measure of agreement that both provides an intuitive interpretation and can be applied to any number of lists even if some or all are incomplete or censored. The approach can identify change-points in the agreement of the lists and the sequential changes of agreement as a function of the depth of the lists can be compared graphically to a permutation based reference set. The usefulness of these tools are illustrated using gene rankings, and using data from two Danish ovarian cancer studies where we assess the within and between agreement of different statistical classification methods.

As stated in many of the other answers, each of these techniques will provide a different summary of those differences and the selection of which is most appropriate for your application is ... well, ... application specific.

$\endgroup$

Your Answer

By clicking “Post Your Answer”, you agree to our terms of service and acknowledge you have read our privacy policy.

Not the answer you're looking for? Browse other questions tagged or ask your own question.