0
$\begingroup$

I have two circular variables and I want to see if they're correlated.

The data comes from a hierarchical and unbalanced experimental design: each participant provided multiple responses and there's many missing data points.

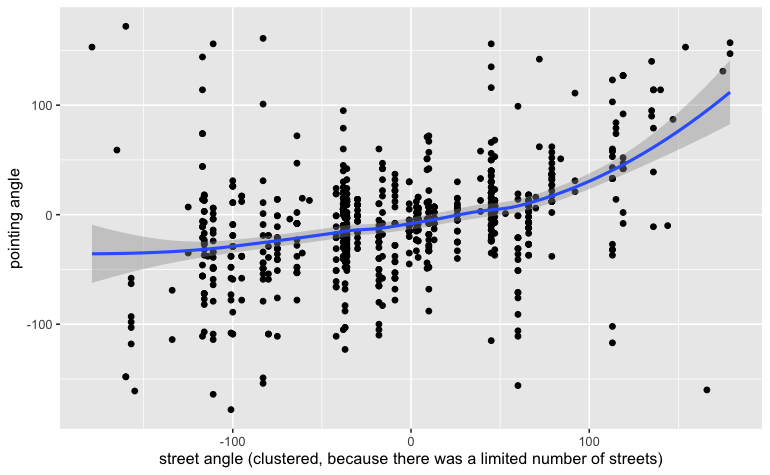
Participants had to point to some distant place in a city. This variable has been transformed to range from -179.9 to +180 so that "0" always means correct pointing to a destination and 180 means pointing in the opposite direction. -10 would mean pointing 10 degrees to the left, etc.

The predictor is the angle of the street they were standing at during this pointing. It has been transformed in the same way, so "0" means that the street was heading exactly towards the destination; -90 would mean that the street was heading 90 degrees to the left relative to the destination, etc. There is only a limited number of streets, so this circular predictor is not evenly spread across the whole -179.9 - +180 scale. Many people were pointing from the same street, so the data is clustered. Also, some streets have many more pointings than others.

scatterplot of the data

I understand that I need a hierarchical (multilevel) circular-circular regression. Here is what I have tried so far (in R) and why it doesn't do the job:

  • circular package fits a circular-circular regression but cannot do a hierarchal regression (it doesn't support random effects).

  • circGLMbayes supports circular outcome but only linear or categorical predictors; doesn't support random effects.

  • brms supports random effects and a "von_mises" family for circular output but as I understand this is equivalent to a circular-linear regression (not circular-circular).

My questions are:

  1. Are there other software solutions for hierarchical circular-circular regression?

  2. Is there a way to transform the predictor term (e.g. in brms) so that it respects the circular nature of this data? I suppose the key problem is that the scale is wrapped, i.e., -179 is in fact very close to +179. Can this be manually accounted for in the model formula?

  3. Since the data is clustered within-streets, I'm wondering if I can code streets as a categorical predictor (ordered or discrete). But I don't know how I would then test a hypothesis that two variables are correlated in some systematic way: an ordered factor would mean that there is a continuous relation but is there a way to make the order of factors wrapped?

  4. Additionally, I want to test an interaction with a third variable (i.e., is the correlation stronger for one condition compared to another). But I suppose it will be the "easy" bit once I have a hierarchical circular-circular model implemented.

Of course I'm also open to using other packages, so will appreciate any hints! Thanks.

$\endgroup$

1 Answer 1

2
$\begingroup$

(Full disclosure: I wrote circglmbayes, but I actually recommend against it because it does not do hierarchical modeling.)

  1. Yes, there is a relevant package that you missed, which is bpnreg. It gives a hierarchical Projected normal model, with linear predictors.

  2. There is indeed a trick to transform circular data to be able to use it in methods that expect linear predictors. In fact, this is the reason that packages such as bpnreg and brms do not implement specific circular-circular methods. The trick is this: if the predictor is $\theta,$ add both the transformations $\cos\theta$ and $\sin\theta$ to the set of predictors. Then, this is transformed by the link function used in brms, or bpnreg, to transform the outcome to a linear predictor as well. It seems a bit weird to transform to linear and back again, but this is the most common way to do this in the circular statistics field (in fact, something similar is going on in circular-circular association in the circular package).

  3. Yes, you can, but this is OK at most. The hierarchical structure is better to do this part, and essentially functions as a group-level predictor (assuming you wish to include random intercepts).

  4. Yes, you can almost always just include interactions.

A final thing to consider is that you have what we would call an 'accuracy' design, where the focus is on deviation from a target angle. If you can live with thinking about the absolute deviation, you can essentially linearize the circular outcome. Then you could do the cos/sin transformation trick and use any other regular hierarchical package.

$\endgroup$
5
  • $\begingroup$ Thanks for your answer. I couldn't understand a few details, could you please clarify? re: 2. is some word missing after "to get" ? I don't understand this sentence. But thanks for the suggestion. So the formula would be: outcome ~ cos(predictor1) + sin(predictor1). Is there a way to intuitively interpret the resulting coefficients? What if cos(predictor1) = 0, and sin(predictor1) ≠ 0 ? Or should I rely on model comparison against the null model in order to interpret the outcome? $\endgroup$ Commented Mar 17, 2021 at 16:20
  • $\begingroup$ re: 4. I understand this would result in the formula outcome ~ condition * sin(predictor1) + condition * cos(predictor1) - is this right? $\endgroup$ Commented Mar 17, 2021 at 16:20
  • $\begingroup$ And w.r.t. your last paragraph: by "linearlize the circular outcome" do you mean: (a) fitting a regular linear regression (e.g., "gaussian" model family in brms instead of "von_mises") or (b) transforming the outcome into absolute error (range: 0-180), and fitting (also as a linear regression): abs(outcome) ~ cos(predictor1) + sin(predictor1) ? $\endgroup$ Commented Mar 17, 2021 at 16:23
  • $\begingroup$ For the first comment: I updated the text in the main answer after 'to get'. Yes, the formula is right. No, there is not really an intuitive interpretation of the parameters (for example, note that outcome ~ cos(x + 1) + sin(x + 1) will give different coefficients but the same model/explained variance. Indeed, it's not really interpretable if the coefficients are zero. The best interpretation is then just a graph of the regression line and data in the x/y space. The best test in then indeed model comparison for adding these predictors (always together). $\endgroup$ Commented Mar 18, 2021 at 5:28
  • $\begingroup$ For the second and third comment: Yes, this is right assuming condition is categorical. 'Linearizing the circular outcome' means to transform this data to the real line in some way so that we can perform linear models. In that case, we would do both (a) and (b), indeed. The other thing to add here is that with this transformation you have to check carefully if the relationship is linear. $\endgroup$ Commented Mar 18, 2021 at 5:42

Your Answer

By clicking “Post Your Answer”, you agree to our terms of service and acknowledge you have read our privacy policy.

Not the answer you're looking for? Browse other questions tagged or ask your own question.